- Field Studies: Replicated Comparisons vs Side-by-Side Comparisons
- Field Studies: Setting Up a Trial
- Field Studies: What do you Mean 5 Bushels Per Acre is not Significant?
With the widespread integration of technology into today’s culture, data and marketing information has become a key part of life. Farmers especially have been targeted with large quantities of new technology created to generate more efficient farming systems and promising easy real-time data access. With large amounts of data and fast access to information and product marketing, producing a commodity requires many decisions.
As the number of US farms has dropped, average farm size has risen 23% from 2009 to 2016 (USDA, 2017). At the same time, producers have seen a shift in the types of ag services available. Having such a wide scope of products and options can make it difficult to determine what products or technologies to invest in and what to leave on the shelf.
The best way to determine if a product or practice is effective is to ask for the data and research backing a company’s claims. Accessing and understanding unbiased product data from well-designed research can be a key aid in making decisions on millions of dollars of ag products each year. Sometimes, companies don’t include vital information on advertising because it’s viewed as confusing and unnecessary. Knowing about how a product has been tested and shown to make a difference should be a deciding factor when making purchases. Yet, it is not that simple in most cases.
False research claims or partial truths are found alongside accurate claims about quality products in marketing information around the world. Separating falsified or misleading claims from those that are not is crucial.
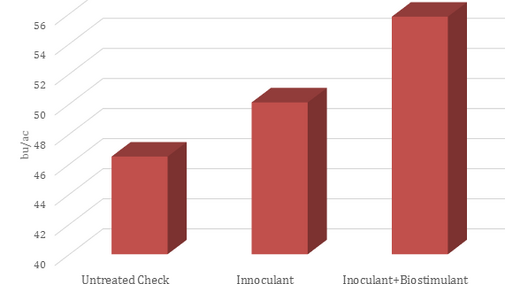
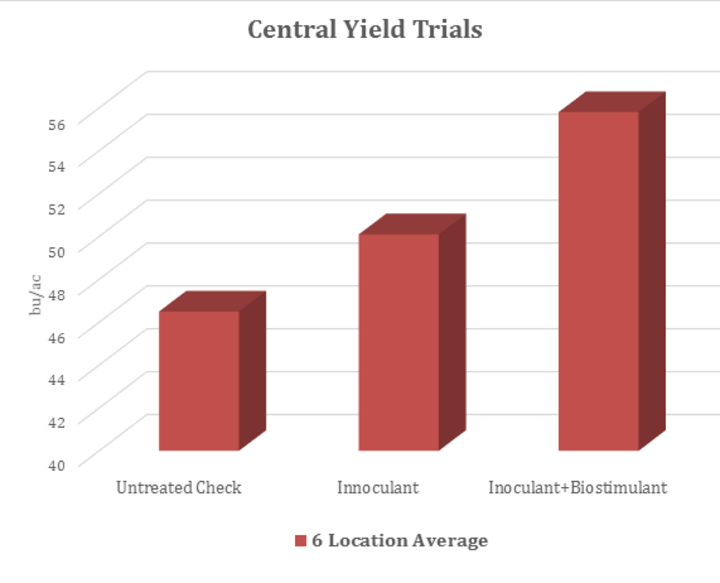
One method some marketers use is to display limited data in a skewed or biased manner by changing the scale of a graphic (Figure 1). Another method is to add disclaimers (Figure 2) or provide vague information and/or nothing to compare the product claims to (Figure 3). However, some companies and institutions provide excellent data with honest results for farmers to choose from; even in these cases, users must understand how to interpret the data (Figure 4).
When a product is falsely promoted, often the customer is provided only the baseline information needed to make a sale. It is vital that farmers take time to look over product information, ask questions, and understand the data presented to them. Knowing how to spot poorly backed claims can offer farmers peace of mind in decision-making and knowing they are investing in products or adapting practices that have been properly tested.
If questions should arise, contact your nearest extension office for data interpretation assistance.
| Alfalfa Component | Before Treatment | 1st Cutting | 2nd Cutting | 3rd Cutting |
|---|---|---|---|---|
| Crude Protein | 23.70% | 25.46% | 23.75% | 28.11% |
| Fat (EE) | 1.89% | 1.76% | 1.80% | 2.11% |
| Calcium | 1.25% | 1.42% | 1.53% | 1.42% |
| Sodium | 0.24% | 0.29% | 0.22% | 0.20% |
| Chloride | 1.31% | 1.36% | 1.20% | 0.60% |
| TDN | 53.96% | 63.35% | 61.51% | 61.41% |
| *Actual results may vary | ||||
Figure 2. Alfalfa yield trial results (fictional example). There is no background information about how or where the data was collected and there are no statistics for the reader to determine if significant differences were found. In addition, the disclaimer at the bottom of the table could nullify any findings should the company choose to do so.
Sample Ad: Hybrid XY Summary
Variety Characteristics
Ear Type: Semi-Determinate
Cob Color: Red
Strengths
High yield potential with great roots. Early flower lends to quick dry-down. Handles different types of soils and responds superbly to intensive management.
Management Tips
A strong performer for its maturity. Likes higher populations for the area and adequate fertility to really shine. Outstanding late season plant health leads to fast dry-down and topmost yields.
Figure 3. Hybrid characteristic advertisement (fictional example). This figure describes a corn hybrid with highly enticing descriptive words that may catch the reader’s attention. No data is provided and there is nothing to compare the above product claims against.
| Fertilizer Applied | Oct. 2013 Soil Test2 for P | Oct. 2013 Soil Test2 for K | Oct. 2013 Soil Test2 for Zn | Yield bu/ac |
|---|---|---|---|---|
| -----ppm 0-6 inches----- | ||||
| Product A | 13 | 150 | 11.5 | 34.1a |
| Product B | 18 | 145 | 13.9 | 34.9a |
| Product C | 3 | 177 | 11.0 | 20.0c |
| Product D | 12 | 115 | 8.5 | 29.6b |
| Pr>F | 0.01 | |||
| CV (%) | 8.7 | |||
| LSD (0.05) | 4.0 | |||
| 1Site in corn/soybean/small grain rotation since 1995. 2Nutrients applied: N= 90 lbs/ac in 2013. Previous nutrients applied since 1997 except for 2013 were: P2O5 at 40 lbs/ac/yr, K2O at 50 lbs/ac/yr, and Zn at 5 lbs/ac/yr |
||||
Figure 4. Comprehensive table that might be used in marketing a product (fictional example). Table includes relevant background information about the trial and statistics to help in interpretation of the information provided.
