
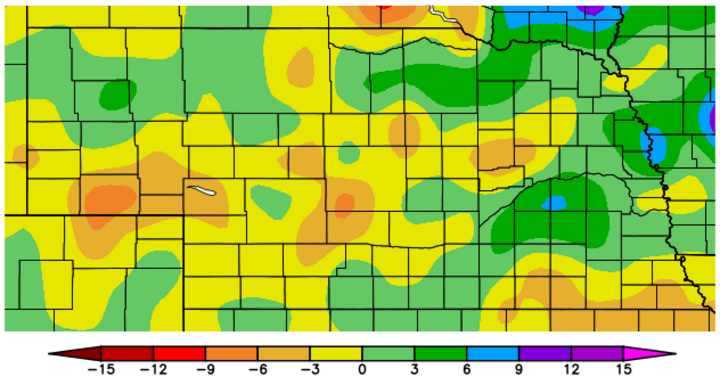
With winter wheat planting drawing near, this is a good time to collect soil samples to determine fertilizer needs for this fall and next year. Available soil water varies across wheat-growing regions in Nebraska this year (Figure 1) which will affect yield potential.
Land with higher precipitation may have had nitrogen (N) move deeper in the soil profile. It is recommended to collect soil samples to at least a 3-foot depth before sowing the wheat crop to determine residual nitrate-N and adjust N recommendations. Detailed information on soil sampling can be found in Guidelines for Soil Sampling (NebGuide G1740) and Soil Sampling for Precision Agriculture (EC154).
Profitable winter wheat production often requires N and phosphorus (P) fertilization. Most Nebraska soils supply adequate nutrients other than N and P.
Nitrogen
Soil test results, fertilizer prices, and expected selling price for wheat are used to calculate both N and P recommendations. (See Fertilizing Winter Wheat, UNL EC143.) As wheat and fertilizer prices can change, a safe approach is to apply a small amount of N (20 lb N per acre) this fall, either row-applied or broadcast. Use soil test results and watch fertilizer and wheat prices over the fall and winter to determine how much additional N might be applied next spring before jointing. Based on a range of current prices for wheat and nitrogen (Table 1), it is still profitable to apply N.
| Wheat Price ($/bu) | $3.50 | $4.50 | $5.50 | $6.50 | ||||||||
| Fertilizer Price $/lb of N | $0.25 | $0.50 | $0.75 | $0.25 | $0.50 | $0.75 | $0.25 | $0.50 | $0.75 | $0.25 | $0.50 | $0.75 |
| Soil test NO3-N ppm | Nitrogen Application Rate - pounds of N per acre | |||||||||||
| 2 | 100 | 45 | 0 | 110 | 70 | 30 | 115 | 85 | 50 | 120 | 95 | 65 |
| 4 | 75 | 25 | 0 | 90 | 50 | 10 | 95 | 60 | 30 | 100 | 75 | 45 |
| 6 | 55 | 0 | 0 | 65 | 25 | 0 | 75 | 40 | 10 | 80 | 50 | 25 |
| 8 | 35 | 0 | 0 | 45 | 0 | 0 | 55 | 20 | 0 | 60 | 30 | 10 |
| 10 | 15 | 0 | 0 | 25 | 0 | 0 | 30 | 0 | 0 | 40 | 10 | 0 |
| 12 | 0 | 0 | 0 | 0 | 0 | 0 | 10 | 0 | 0 | 15 | 0 | 0 |
Phosphorus
Nebraska data shows up to a 20 bu/ac increase when applying P to low soil test levels (
Dual-applied P and seed-applied (row) P perform equally at optimum seeding dates (see recommended dates). Phosphorus recommendations in wheat depend on several factors. All information needed to determine P rates as well as example calculations are provided in Fertilizing Winter Wheat (UNL EC143).
