In last week’s article I presented data that attempted to quickly summarize how temperatures performed during June and July in relation to the same period in 2015. A quick summary of the data indicated that most of eastern Nebraska was dominated by exceptionally warm maximum temperatures during June, while western Nebraska experienced most of its heat in July. Elevated minimum temperatures were more of an issue for eastern Nebraska in July because of dew point temperatures consistently showing readings in the 70s. (Generally, evening dew point temperatures are an indication of where minimum temperatures will be the following morning.)
As mentioned last week, we have received calls from producers questioning the impact of warm temperatures on corn development due to the rapid onset of early dent on corn planted in April. The Nebraska State Climate office ran a series of GDD calculations using two methods: the old standard method which totaled GDDs accumulated between 86°F/50°F base temperatures (see box) and one that has no limit on the maximum temperature while still maintaining a lower limit of 50°F.
We ran this analysis from April 15 and from June 1 to present. We found GDD accumulation differences between the two methodologies were virtually non-existent between April 15 and June 1. However, significant differences materialized once we moved into June. Since both equations capture the impacts of elevated minimum temperatures equally, the determining factor between the two equations is 1) the number of days above the upper threshold limit of 86°F and 2) the intensity of those differences.
Calculating Growing Degree Days (GDDs)
Method 1 Calculation
GDD = [Daily Maximum Air Temperature (capped at 86°F*) + Daily Minimum Temperature]/2 – 50.
*When the maximum air temperature is greater than 86°F, the maximum value used in the equation is still 86, as the rate of corn growth is not expected to increase beyond 86°F. Likewise, when minimum air temperature is less than 50°F, the value 50 is used in the equation.
For example, if the maximum and minimum temperatures for a day were 96°F and 72°F, respectively, here's how the two methods would calculate GDD:
Method 1
GDD = (86 + 72)/2 - 50 158/2 - 50 = 29 GDD would be accumulated that dayMethod 2
GDD = (96 + 72)/2 - 50 168/2 - 50 = 34 GDD would be accumulated that day


Figure 1 shows the differences between the two methodologies using data from our automated weather station mesonet, a statewide network of environmental monitors. The most significant difference are across western Nebraska where maximum temperatures in July were much warmer that in eastern Nebraska. With dry conditions and some moderate drought across the northern Panhandle, maximum temperatures for more than half of July were in the 95-105°F range.
Most of the accumulated differences across eastern and southern Nebraska occurred in June when temperatures exceeded the 90°F mark for 10 to 20 days, with the highest totals reported across southeastern Nebraska. Unless you know the history of GDD accumulations during from June through August, the numerical values in Figure 1 may not contain enough information to make an informed decision.
If you convert the differences in Figure 1 to percent accumulation difference between the old GDD calculation and one with an unlimited upper base, a more interesting picture occurs. Figure 2 indicates that using the unlimited upper base equation generated 5%-10% greater GDD accumulations during the past 2.5 months across western Nebraska. The range of differences across eastern Nebraska varies from 3% to 7%, with the smaller values occurring across northeastern Nebraska.
In short, the differences between the eastern and western regions of the state in regards to temperature impacts occurred during two distinct time frames. For eastern Nebraska, much of the blazing heat occurred during the vegetative phase for corn, while western regions experienced their worst heat just prior to pollination through the first half of grain fill.
Outlook for Remainder of August
It does appear that weather models are backing off of excessive heat for the remainder of August, with short-term trends pointing toward below normal temperatures through the end of August. Although a day or two of maximum temperatures in the 90s may impact the western half of the state, most locations will remain in the 80s or lower as the jet stream begins to pull Canadian air masses into the region. This should also increase our opportunities for above normal rainfall, if the models are correct.
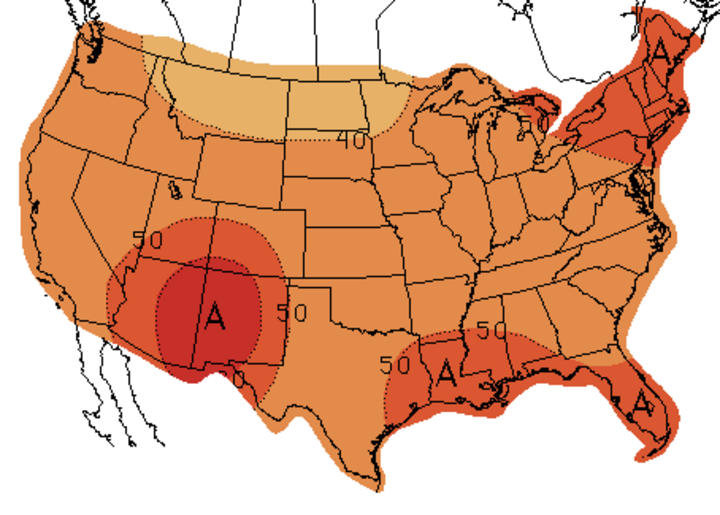
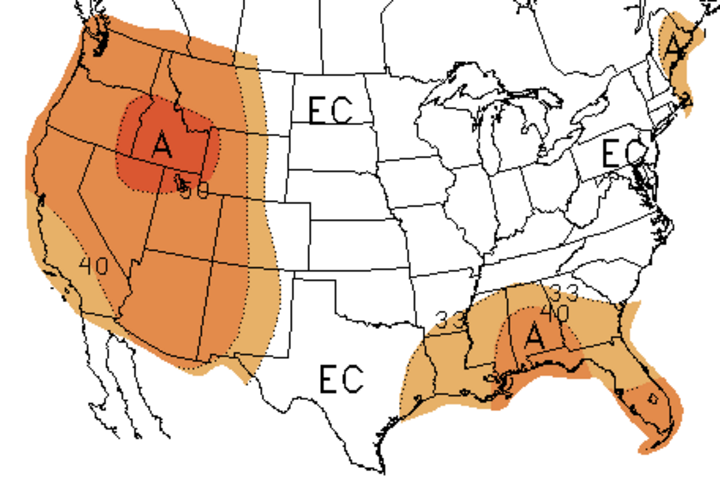
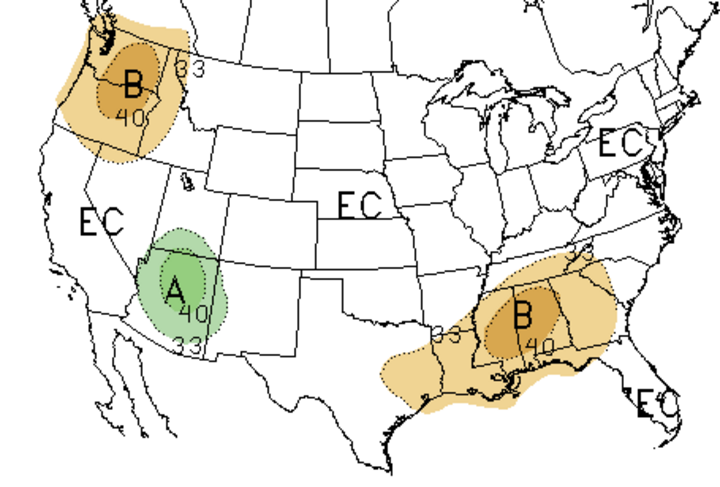
The early release of the 30- and 90-day outlooks (Figures 3-6) from the Climate Prediction Center fail to show any moisture trend for the central Plains. Some above-normal moisture is indicated for the Dakotas, but in the remainder of the Corn Belt there are equal chances for above normal, normal, or below normal precipitation. Temperature forecasts only show a moderate tendency for above normal temperatures during the September-November period for the entire continental United States.
