- March (@KWH),
- May (@KWK),
- July (@KWN),
- September (@KWU), and
- December (@KWZ).
These differences are called “carrying charges” or “spreads.” In order to take advantage of higher wheat futures prices, grain can be priced and stored for delivery to a local elevator at a later date. This strategy is called “selling the carry.” The most common way to sell the carry is to use a cash forward contract or a hedge to arrive (HTA) contract.

A cash forward contract is a contract that determines the cash price of the grain for delivery at a specified date. This contract should be used if you anticipate that futures prices will decline and basis will weaken.
An HTA contract sets the futures price of a contract for delivery, without setting the basis. (Cash Price equals futures price plus basis: Cash = futures + basis.) The basis will be set at a later date, as determined by the contract. This contract should be used if you think that futures prices will decline and basis will improve. It is likely that basis bids today for future delivery, say December, will be weak, implying the need to use an HTA.
Selling grain today for future delivery, whether through an HTA or cash forward contract, implies you do not expect futures prices to improve. Leaving wheat unpriced exposes the producer to the risk of lower prices in the future. However, storing unpriced wheat may not be as risky since current wheat prices are near Loan Deficiency Payment (LDP) levels providing farmers a price floor of $2.94 per bushel. The reward for leaving wheat unpriced could be higher prices later in the year but with the quantity of wheat in the national and international market this does not appear likely.
The first step to using one of these contracts is determining when to deliver grain to the elevator. The price for each day of the delivery month of the winter wheat contract is different.
The question is: How large must the carrying charge be to cover the additional storage cost and interest expense from holding grain until the later date? To determine if it is profitable to store grain, compare the interest cost to the current carrying charge.
Let’s assume that a Sidney farmer is looking to price wheat on or after July 15, making the nearby winter wheat contract @KWU (September) which is current trading at $4.23 per bushel. The current cash price is $3.10 per bushel (indicating a -$1.13 per bushel basis). The farmer wants to see if it is profitable to price grain today on @KWZ (December) which is $4.48 per bushel, delivering the wheat to the local elevator before November 30.
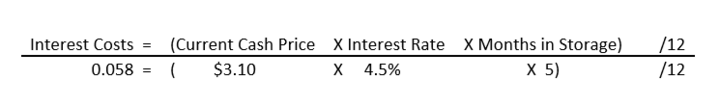
First, the farmer needs to calculate the cost of interest. The farmer has an existing operating note at a 4.5% interest rate and there are five months of storage (July to December).
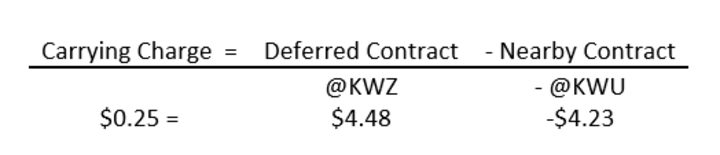
Next, the farmer needs to calculate the carrying charge.
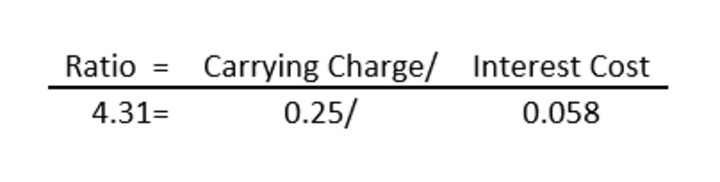
Finally, the interest cost-to-carry ratio is calculated by dividing the carrying charge by the interest cost.
| Date | Sidney Cash Price | @KWU (Sep) | Interest Rate1 | @KWZ (Dec) | Ratio | @KWH (Mar) | Ratio | @KWK (May) | Ratio | @KWN (July) | Ratio |
|---|---|---|---|---|---|---|---|---|---|---|---|
| 7/20/2006 | 4.66 | 5.03 | 9.25% | 5.18 | 0.84 | 5.20 | 0.62 | 5.01 | -0.04 | 4.90 | -0.29 |
| 7/19/2007 | 5.38 | 6.07 | 9.25% | 6.22 | 0.71 | 6.31 | 0.73 | 6.15 | 0.20 | 5.61 | -0.92 |
| 7/17/2008 | 7.46 | 8.39 | 6.00% | 8.61 | 1.19 | 8.83 | 1.49 | 8.96 | 1.54 | 8.94 | 1.24 |
| 7/16/2009 | 4.55 | 5.60 | 4.25% | 5.76 | 2.05 | 5.93 | 2.56 | 6.04 | 2.73 | 6.15 | 2.84 |
| 7/22/2010 | 4.41 | 6.12 | 4.25% | 6.29 | 2.24 | 6.45 | 2.66 | 6.53 | 2.63 | 6.60 | 2.59 |
| 7/21/2011 | 6.79 | 7.74 | 4.25% | 7.98 | 2.00 | 8.11 | 1.90 | 8.16 | 1.73 | 8.19 | 1.54 |
| 7/19/2012 | 8.52 | 9.38 | 4.25% | 9.51 | 0.86 | 9.47 | 0.35 | 9.39 | 0.03 | 8.70 | -1.88 |
| 7/18/2013 | 7.12 | 7.02 | 4.25% | 7.16 | 1.09 | 7.26 | 1.19 | 7.31 | 1.15 | 7.27 | 0.81 |
| 7/17/2014 | 5.92 | 6.49 | 4.25% | 6.60 | 1.05 | 6.67 | 1.09 | 6.72 | 1.09 | 6.59 | 0.40 |
| 7/16/2015 | 4.96 | 5.53 | 4.25% | 5.73 | 2.25 | 5.87 | 2.39 | 5.95 | 2.38 | 6.01 | 2.26 |
| Average | 5.98 | 6.74 | -- | 6.90 | 1.43 | 7.01 | 1.50 | 7.02 | 1.34 | 6.90 | 0.86 |
| 1 Interest rates vary by operation. This value is the national prime rate plus 1 percentage point. | |||||||||||
If this ratio is greater than 1.40, the carrying charge is large enough for the farmer to gain from using an HTA or cash forward contract. The larger the value, the higher the returns from storage. In this example, the ratio is large enough for the farmer to benefit from a cash forward or HTA contract.
Some may be wondering, why is interest expense a concern when selling grain? If a farmer sells their grain earlier in the year, they can use the cash to pay down on their operating note, or other expenses. If a farmer holds grain unpriced, they are paying interest on a larger amount of debt. The local price, interest rate, and storage expense vary by operation. The above calculation allows a farmer to estimate quickly if “selling the carry” is profitable for the operation.
Table 1 shows the Sidney cash price, the interest rate, and the contract prices for the four deferred contracts on the first Thursday after July 15 since 2006. The yellow shaded values indicate a ratio higher than 1.40; the green shaded boxes indicate the most profitable deferred contract.
As illustrated by Table 1, for five out of ten years it has been profitable for farmers in Sidney to sell the carry. It is likely that similar results can be found across Nebraska, depending on the basis and the farmer’s interest rate. Large carrying charges are usually associated with large carryover stocks and high yields like we are experiencing now.
Looking at June 2016 ratios of carrying charge to interest, it is clear that there are prominent signals for winter wheat producers to price grain now for delivery in a future month. Table 2 outlines these ratios, the yellow shaded boxes indicate the highest returns from storage. If these spreads hold into harvest it may be advantageous for producers to use a cash forward contract or HTA rather than a cash bid to market their winter wheat.
| Date | Sidney Cash Price |
@KWU | Interest Rate1 | @KWZ (Dec) | Ratio | @KWH (Mar) | Ratio | @KWK (May) | Ratio |
|---|---|---|---|---|---|---|---|---|---|
| 1-Jun | 3.75 | 4.72 | 4.5% | 4.96 | 3.31 | 5.12 | 3.52 | 5.22 | 3.52 |
| 2-Jun | 3.89 | 4.81 | 4.5% | 5.05 | 3.29 | 5.21 | 3.47 | 5.31 | 3.46 |
| 3-Jun | 3.93 | 4.90 | 4.5% | 5.13 | 3.16 | 5.29 | 3.35 | 5.39 | 3.36 |
| 6-Jun | 3.96 | 4.98 | 4.5% | 5.22 | 3.16 | 5.38 | 3.37 | 5.48 | 3.37 |
| 7-Jun | 3.95 | 5.01 | 4.5% | 5.25 | 3.27 | 5.42 | 3.46 | 5.52 | 3.43 |
| 8-Jun | 4.01 | 5.09 | 4.5% | 5.34 | 3.23 | 5.50 | 3.37 | 5.60 | 3.35 |
| 9-Jun | 3.92 | 5.01 | 4.5% | 5.26 | 3.37 | 5.42 | 3.47 | 5.51 | 3.42 |
| 10-Jun | 3.77 | 4.86 | 4.5% | 5.10 | 3.47 | 5.26 | 3.56 | 5.36 | 3.58 |
| 13-Jun | 3.69 | 4.78 | 4.5% | 5.03 | 3.58 | 5.19 | 3.66 | 5.29 | 3.69 |
| 14-Jun | 3.67 | 4.77 | 4.5% | 5.01 | 3.60 | 5.17 | 3.71 | 5.28 | 3.73 |
| 15-Jun | 3.65 | 4.75 | 4.5% | 5.00 | 3.66 | 5.16 | 3.75 | 5.26 | 3.75 |
| 16-Jun | 3.59 | 4.69 | 4.5% | 4.94 | 3.76 | 5.10 | 3.86 | 5.21 | 3.87 |
| 17-Jun | 3.69 | 4.79 | 4.5% | 5.03 | 3.51 | 5.19 | 3.62 | 5.29 | 3.65 |
| 20-Jun | 3.59 | 4.69 | 4.5% | 4.94 | 3.76 | 5.11 | 3.88 | 5.22 | 3.91 |
| 21-Jun | 3.43 | 4.53 | 4.5% | 4.78 | 3.97 | 4.95 | 4.09 | 5.05 | 4.11 |
| 22-Jun | 3.41 | 4.51 | 4.5% | 4.77 | 3.99 | 4.93 | 4.11 | 5.04 | 4.13 |
| 23-Jun | 3.36 | 4.46 | 4.5% | 4.71 | 4.01 | 4.88 | 4.17 | 4.98 | 4.15 |
| 24-Jun | 3.31 | 4.41 | 4.5% | 4.67 | 4.16 | 4.83 | 4.26 | 4.94 | 4.26 |
| 27-Jun | 3.18 | 4.31 | 4.5% | 4.57 | 4.32 | 4.74 | 4.43 | 4.84 | 4.42 |
| 28-Jun | 3.15 | 4.28 | 4.5% | 4.54 | 4.37 | 4.71 | 4.48 | 4.81 | 4.47 |
| 29-Jun | 3.06 | 4.20 | 4.5% | 4.46 | 4.49 | 4.62 | 4.60 | 4.73 | 4.64 |
| 30-Jun | 3.10 | 4.23 | 4.5% | 4.48 | 4.35 | 4.64 | 4.50 | 4.75 | 4.52 |
| 1Interest rates vary by operation. | |||||||||
With 2016’s wheat harvest moving north, prices continue to decline but the carrying charge has remained. Taking advantage of the carry may help increase your income. Local elevators may not offer HTA contracts. Consult with your local grain merchandiser about what types of contracts are available and the terms of those contracts.
