(Revised January 25, 2017)
Individual marketing plans contain both producer expectations and market fundamentals. In order to improve marketing plans it is important to understand how market fundamentals could impact changes in future prices.

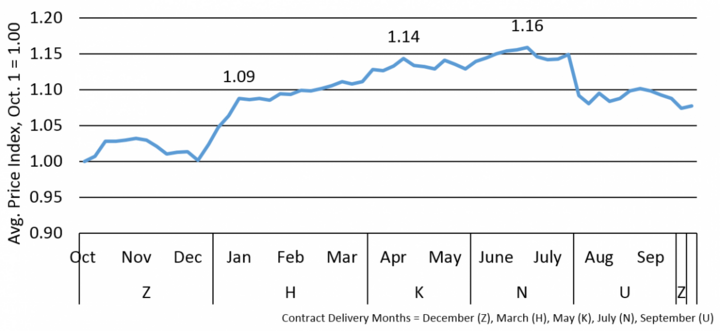
Figure 1. 1996-2016 average price index for the Nearby Chicago corn contract.

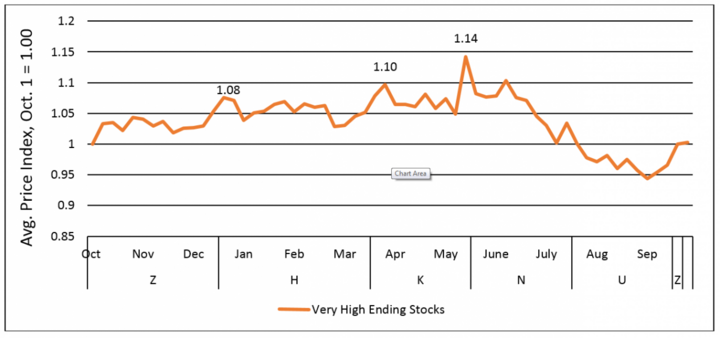
Figure 2. Average Price Index for Very High Ending Stock years

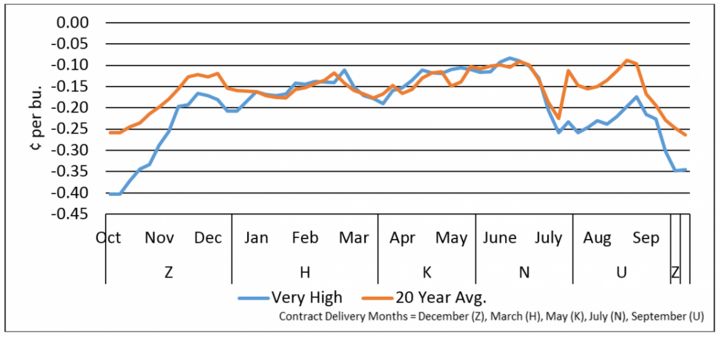
Figure 3. 20-year average and very high ending stocks basis pattern, Omaha.
| Very Low | Low | High | Very High |
|---|---|---|---|
| 119-151 MMT | 151-183 MMT | > 183 MMT | |
| 2003 | 2002 | 1996 | 1998 |
| 2006 | 2004 | 1997 | 1999 |
| 2005 | 2000 | 2014 | |
| 2007 | 2001 | 2015 | |
| 2008 | |||
| 2009 | |||
| 2010 | |||
| 2011 | |||
| 2012 |
Because of the cyclical nature of growing crops, commodity prices could follow a similar pattern, a pattern that may be useful to marketing decisions. An inspection of historical (20-year) prices can give us some insight (Figure 1). Prices in Figure 1 are normalized to 1 in October to allow a comparison between historical price series. According to the 20-year average price index for post-harvest corn, prices are highest in late June. On average the price of the Chicago corn contract is 16% higher during the historical period analyzed than it was on Oct. 1. The 20-year average Price Index suggests that holding old crop corn into summer may provide the highest price; however, we need to inspect whether this result holds when accounting for more information.
Understanding factors that influence price patterns can help you develop a more robust post-harvest marketing plan. If prices are a function of supply and demand, different price patterns could form given different supply and demand conditions. One important piece of information influencing supply and demand is ending stocks, or how much corn is carried forward from one crop year to the next. To evaluate the effects supply has on price patterns, we looked at global ending stocks for corn from 1996-2015. We placed each year into one of four categories (Table 1):
- Very Low — less than 119 Million Metric Tons (MMT);
- Low — 119 –151 MMT;
- High — 151 – 183 MMT; and
- Very High — greater than 183 MMT.
The Oct. 12 World Agriculture Supply and Demand Estimate (WASDE) report expects the 2016/17 global ending stocks to be 216.8 MMT, placing this year in the Very High ending stocks category.
Although some may expect large ending stocks to suppress post-harvest prices, Figure 2 shows that Very High ending stock years show low prices during the December Chicago Corn (Z) contract. Once the December contract has expired, the March (H) and May (K) contracts provide the highest prices for post-harvest marketing.
Assuming the above price pattern holds true, we may expect futures prices to increase 28% from the Oct. 1 price to early January. Farmers should only expect 10%-14% price increases during the spring raly into early June.
Another concern may be changes in basis that can take away or add to futures price gains. Figure 3 shows basis patterns for Omaha. During the December corn contract (Z), basis has been weaker for the very high ending stocks years when compared to the 20-year average. However, during the March (H), May (K), and July (N) contracts, the basis returns to about average. The basis then weakens again during the September (U) and December (Z) contracts.
Another consideration for those with on-farm storage may be carrying charges. A carrying charge is the difference in price between contract months.
The Chicago Corn market has five contract delivery months: March (H), May (K), July (N), September (U), and December (Z). The price for each of these contracts is different. These differences are called “carrying charges” or “spreads.” In order to take advantage of higher corn futures prices, grain can be priced and stored for delivery to a local elevator at a later date. This strategy is called “selling the carry.”
Carrying charges for the second and third differed contract are larger (more positive) during years with very high ending stocks until July 14, as shown in Table 2. This means that producers with on-farm corn storage could see positive returns by using a cash-forward contract or hedge-to-arrive (HTA) contracts to price grain for later delivery.
Currently, the carrying charge expectations are holding true. (See Table 3.)
| Oct. 1 – Dec. 14 | Dec. 15 – Mar. 14 | Mar. 15 – May 14 | May 15 – Jul. 14 | Jul. 15 – Sep. 14 | |
|---|---|---|---|---|---|
| 1st Deferred Contract | H | K | N | U | Z |
| 20-Year Avg. | $0.10 | $0.06 | $0.03 | - $0.05 | - $0.10 |
| Very High Ending Stocks | -$0.41 | $0.53 | $0.69 | $0.77 | - $0.81 |
| 2nd Deferred Contract | K | N | U | Z | H |
| 20-Year Avg. | $0.17 | $0.12 | $0.04 | - $0.01 | $0.21 |
| Very High Ending Stocks | $0.26 | $0.19 | $0.08 | $0.01 | $0.04 |
| 3rd Deferred Contract | N | U | Z | H | K |
| 20-Year Avg. | $0.22 | $0.03 | - $ 0.04 | $0.09 | $0.21 |
| Very High Ending Stocks | $0.32 | $0.25 | $0.17 | $0.12 | $0.03 |
| Date | @CZ16 Closing Price | 1st Deferred Contract | 2nd Deferred Contract | 3rd Deferred Contract | 4th Deferred Contract |
|---|---|---|---|---|---|
| 10/3/2016 | $3.46 | $0.10 | $0.17 | $0.23 | $0.38 |
| 10/4/2016 | $3.48 | $0.10 | $0.17 | $0.24 | $0.39 |
| 10/5/2016 | $3.48 | $0.10 | $0.17 | $0.24 | $0.39 |
| 10/6/2016 | $3.41 | $0.10 | $0.17 | $0.24 | $0.40 |
| 10/7/2016 | $3.40 | $0.10 | $0.17 | $0.24 | $0.40 |
| 10/10/2016 | $3.43 | $0.10 | $0.17 | $0.24 | $0.40 |
| 10/11/2016 | $3.46 | $0.10 | $0.16 | $0.23 | $0.39 |
| 10/12/2016 | $3.37 | $0.10 | $0.17 | $0.24 | $0.40 |
| 10/13/2016 | $3.50 | $0.10 | $0.17 | $0.23 | $0.39 |
| 10/14/2016 | $3.54 | $0.10 | $0.16 | $0.22 | $0.37 |
The final consideration is storage expense. Although expenses have very little fluctuation from year to year, deciding to hold corn until the price, and/or basis improve will come with storage expense.
By viewing only years with very high ending stocks, we are able to get a clearer picture of seasonal price patterns, basis expectations and carrying charges under large supply conditions. As we prepare to place the 2016 crop in the bin, we can expect futures prices to be at or around the Oct. 1 price of $3.46 until January, with a relatively weak basis, and strong 2nd and 3rd differed contract prices.
Producers storing grain for spring delivery face two options:
- Sell today for future delivery. In this scenario they would guarantee about $0.10 more in futures price than currently offered. This is a low risk move with a small reward.
- Leave corn unpriced and follow the seasonal chart, implying the possibility of a 28% increase in price or $0.28/bu. This is a high risk scenario, given cash corn price is trading below cost of production. One tool to lower price risk for this scenario would be to buy an at-the-money-put option for the same futures contract you plan on delivering on. If futures prices drop dramatically by the spring then the put option would gain in value relative to what you paid for it. If futures prices increase then you get that futures price less the cost of the put option.
These data and comments are provided for information purposes only and are not intended to be used for specific grain marketing strategies. Past performance is not necessarily indicative of future results. Grain marketing involves risk, and you should fully understand these risks before implementing a grain marketing strategy.
