For the rest of the story, see 2016 Corn Yield Forecasts as of September 7.

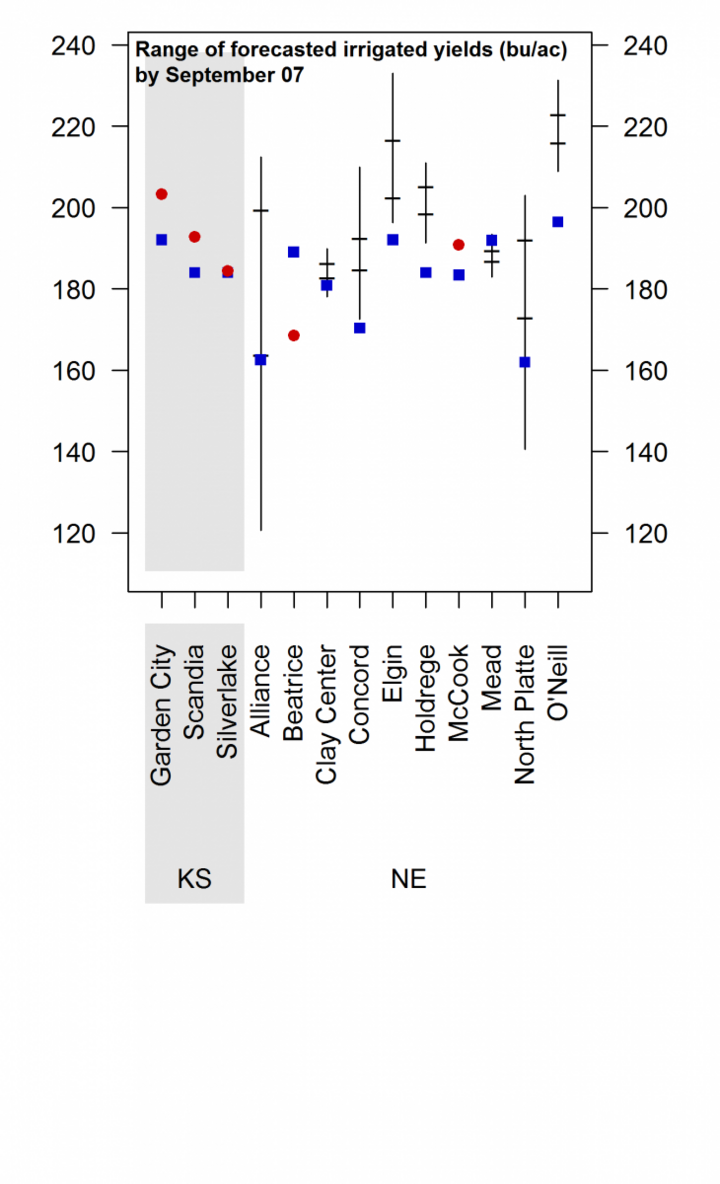
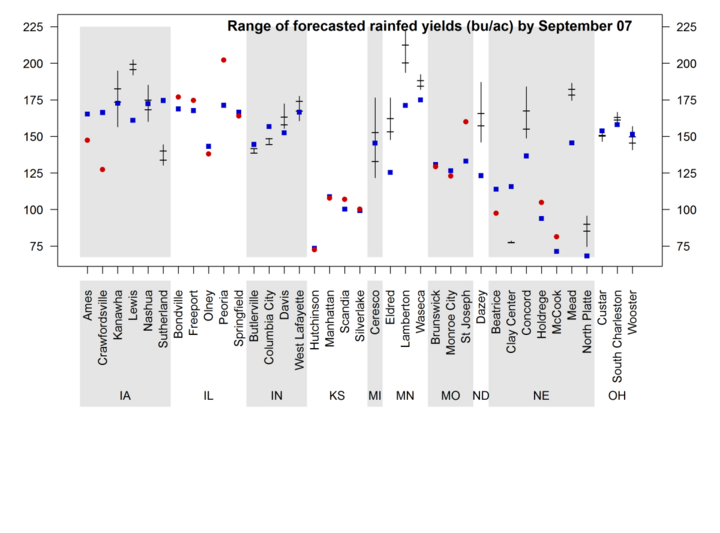
Figure 3. Vertical lines indicate the range of forecasted 2016 average corn yield by September 7 based on average planting date in 2016 at each location. Horizontal lines indicate the 25th and 75th percentiles of the yield distribution (associated with respective adverse and favorable weather scenarios during the rest of the season). Long-term (2005-2014) average yield at each location is indicated with a blue square. Final forecasted yield is indicated with a red square for those sites where corn already matured.

