Figure 3 of 2016 Corn Yield Forecasts as of July 27

Figure 3 of 2016 Corn Yield Forecasts as of July 27

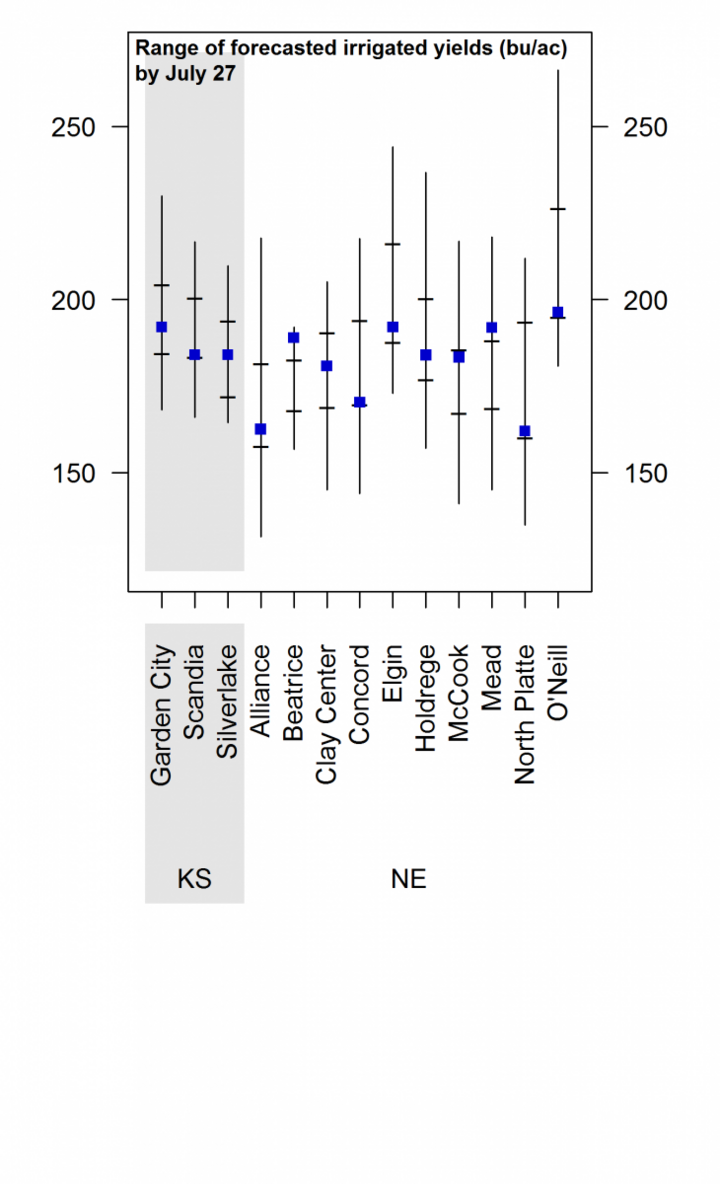
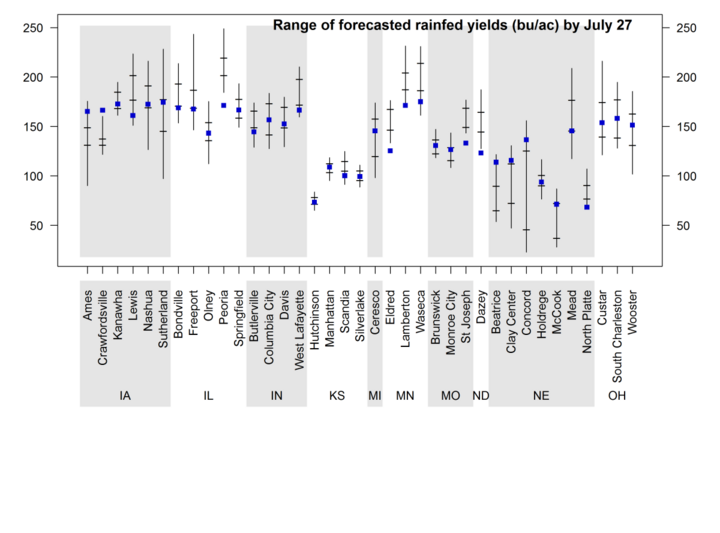
For the rest of the story, see 2016 Corn Yield Forecasts as of July 27.

simulated irrigated corn yields
Figure 3. Vertical lines indicate the range of forecasted 2016 corn yields by July 27 based on average planting date in 2016 at each location. Horizontal lines indicate the 25th and 75th percentiles of the yield distribution (associated with respective adverse and favorable weather scenarios during the rest of the season). Long-term (2005-2014) average yield at each location is indicated with a blue square. Separate charts are shown for irrigated corn (top) and rainfed corn (bottom).
forecast rainfed corn yields

Online Master of Science in Agronomy

With a focus on industry applications and research, the online program is designed with maximum flexibility for today's working professionals.

A field of corn.