The Yield Forecasting Center will be providing in-season corn yield forecasts every two weeks starting in mid-July to aid growers and the ag industry in making management, logistics, and marketing decisions through the season. The Center consists of a core team at UNL in collaboration with agronomists and extension educators from universities throughout the Corn Belt.


In 2015, corn yield forecasts were released during the growing season for Nebraska and eight other states (Iowa, Illinois, South Dakota, Kansas, Indiana, Ohio, Missouri, Minnesota, and Wisconsin) across the Corn Belt. This year the Yield Forecasting Center expanded its coverage to includes new locations in Minnesota, North Dakota, and Michigan (Figure 2). We will provide bi-weekly forecasts of corn yield for 41 locations, which will allow us to have almost full coverage of the Corn Belt. These forecasts will be released as CropWatch articles, starting in mid-July and continuing until the end of the season. Unfortunately, yield projections for South Dakota will not be available this year because the public-sector South Dakota weather data were not available to this project. Likewise, Wisconsin Mesonet has stopped providing real-time weather data due to lack of support to operate its weather network.
This article summarizes the methodologies used by the Yield Forecasting Center to forecast corn yield and provides guidelines for interpreting the results.
The Center relies on
- a network of collaborators providing local management data and verifying forecasted yields,
- precise information on dominant soil types in each region,
- measured high-quality, real time weather data, and
- a well-validated crop simulation model (UNL Hybrid Maize).
More information about data sources and modeling can be found at the Global Yield Gap Atlas website.
Local agronomists and extension educators provide information on management and soil data in each state, and help validate and interpret the forecasts (Figure 3). Information provided by collaborators includes site-specific average planting date (i.e., average calendar date at which 50% of the corn area was planted in the current season), plant density, and hybrid maturity (Table 1). When both rainfed and irrigated production occurs at an observation location, separate sets of management practices are used for simulating rainfed and irrigated crops at those sites because water regime has a large influence on production practices. Management data have been further validated using information provided by DuPont Pioneer agronomists, especially with regard to hybrid maturity and plant density.

Figure 3. Yield Forecasting Center collaborators for 2016
Yield forecasts are based on the two to three dominant soil types at each location. Yield is forecasted separately for each soil type. Yield predictions are subsequently aggregated by averaging the forecasts across soil types, after weighting them according to prevalence of each soil type in each location (Table 2).
Historical (last 20+ years) and real-time daily weather data are needed for yield forecasting. Meteorological variables required for simulating real-time crop growth and development includes solar radiation, maximum and minimum temperature, precipitation, relative humidity, wind speed and precipitation. The Yield Forecasting Center relies on measured data collected through state weather networks, including
- the High Plains Regional Climate Center (HPRCC),
- the National Weather Service (NWS) station network,
- the Illinois Water and Atmospheric Resources Monitoring Program (WARM),
- the Ohio State University Ohio Agricultural Research and Development Center (OARDC) Weather Service,
- the Indiana Purdue Automated Agricultural Weather Station Network (PAAWS),
- the Southern Research and Outreach Center (SROC) and the Southwest Research and Outreach Center (SWROC) at the University of Minnesota,
- the Missouri Mesonet (AgEBB),
- the North Dakota Agricultural Weather Network (NDAWN), and
- the Michigan State University Enviro-Weather.
Meteorological stations selected from these networks for use in yield forecasting are located in agricultural areas, rather than in urban areas, which helps to ensure the representativeness of the weather data for forecasting corn yields.
Hybrid-Maize Yield Simulations
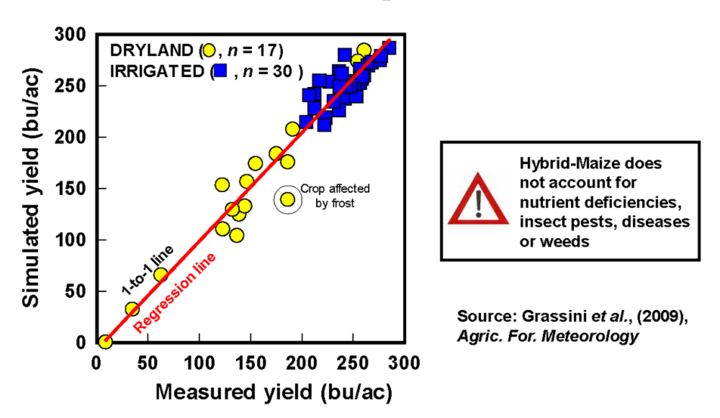 Figure 4. Validation of Hybrid-Maize simulations of final yield (bushels per acre) against actual yields in optimally managed crops, under irrigated and rainfed conditions.

Hybrid-Maize is a corn simulation model developed by UNL researchers that simulates daily corn growth and development and final grain yield under irrigated and rainfed conditions. The model estimates "yield potential," which is the yield obtained when the crop is not limited by nutrient supply, diseases, insect pressure, or weed competition — conditions that represent an "optimal management" scenario. It also assumes uniform plant stand at the specified plant population and no problems from flooding or hail. Although the model can account for water stress and high temperatures during vegetative growth and the grain filling period, it will likely not portray well yield of crops under two situations:
- years when a crop suffers very severe heat and water stress during the silking and pollen shed (i.e., flowering) window of about seven days, and
- when an early frost kills the crop well before grain filling is completed.
But, even with these relatively uncommon provisos, the model has been successfully evaluated across a wide range of environments where corn produced yields varying from 10 to 300 bu/ac (Figure 4).
| Accounted Factors | Non-Accounted Factors |
|---|---|
| Solar radiation Temperature Relative humidity Wind speed Reference evapotranspiration Precipitation Soil type Soil water at planting Plant population density Hybrid maturity Planting date |
Nutrient supply Incidence of biotic stresses (weeds, insect pests, pathogens) Flooding Hail Lack of stand uniformity Soil crusting Severe heat/water stress around silking Early killing frost Green snap/lodging |
How do we forecast real-time, average on-farm corn yields?
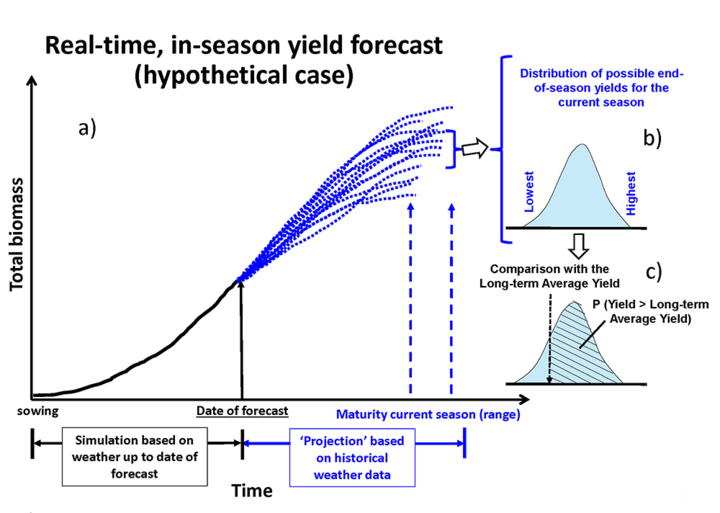 Figure 5. a) Diagram showing how the yield forecasts are performed with Hybrid-Maize. b) The distribution of possible end-of-season yields. c) Comparison of the distribution of forecasted yields against the long-term (20+ year) mean yield (black arrow) allows to estimate the probability (P) of above-average end-of-season yield (dashed area).

Hybrid-Maize uses measured weather data to simulate crop growth until the forecast date (solid black line in Figure 5a). Historical (20+ years) weather data are used to predict all possible weather scenarios for the rest of the season (blue dotted lines in Figure 5a). This results in a range of possible end-of-season yields (blue distribution in Figure 5b). By comparing the distribution of forecasted yields (blue-shaded area in Figure 5c) against the average yield simulated for the same location using the historical weather data (vertical arrow in Figure 5c), it is possible to determine the likelihood (probability) for current season yields that are below, near or above long-term average yield (dashed area in Figure 5c).
In order to predict average actual farm yield for each location, the simulated yield is adjusted based on the yield gap (difference between potential yield and actual farm yield) reported for each location by the Global Yield Gap Atlas (www.yieldgap.org). Yields reported by the Yield Forecasting Center more closely track yields achieved in fields that did not suffer severe yield losses due to pests, hail, waterlogging, poor establishment or substantially affected by a stress not accounted for in the Hybrid-Maize model. Finally, note that the yield forecast is not field-specific and, instead, it provides insights about the expected average on-farm yield for a given location in absence of the previous yield-reducing factors.
What reports can you expect during the growing season?
Early in the season (May-June), yield forecasts for the current season mainly rely on historical weather and the range of forecasted yields will be wide and almost identical to the range of yields based on the historical weather data alone. As the season progresses (July-early August), and more of the current season’s weather data are used in the simulations, the range of forecast yields will start to narrow and may (or may not) deviate from the long-term average yield, depending upon similarity of the current season’s weather relative to the long-term average weather patterns. As the crop approaches maturity (end of August-September), the range of forecasted yields will further shrink and final yield can be forecasted with greater confidence.
How to Use These Forecasts to Inform Farm Decisions
When complemented with other sources of information, personal experience, and best judgment, the information provided by the Yield Forecasting Center allows adjusting yield goals for the current growing season in comparison to normal years, and in some cases this insight can support management decisions such as timing and amounts of fertilization and irrigation, or application of pesticides during the grain-filling period. Information from simulations during grain-filling provides additional information to guide marketing decisions for all participants in the corn supply chain at regional and national levels (producers, livestock sector, ethanol industry, insurance companies, companies involved in commercialization and transportation, and policy makers).
During the 2015 UNL Crop Production Clinics, attendees (mostly crop growers and consultants) were asked about the yield forecasts released during the 2014 crop season. (See July-October 2014 CropWatch issues.) Half of the attendees followed the 2014 yield forecasts. Of the total attendees, one third recognized the value of the forecasts to inform marketing decisions; a third saw the value for improving management decisions; a third were interested in using the yield forecasts as benchmarks to diagnose yield gaps on their farms. (See 2015 forecasts in July-October 2015 CropWatch issues.)
Yield forecasts will be released as bi-weekly CropWatch articles during the 2016 crop season, starting in mid-July. We also will provide information on the range of forecasted yields, probabilities for above-, near-, or below-normal yields, and information about crop phenology and the probability of an early killing frost. Forecasts will be discussed in relation to the current season’s weather versus the normal weather for each location to identify regions where yields are predicted to be well above, below, or near the long-term average. Further details about the methodology used to generate the yield forecasts can be found in "Can crop simulation models be used to predict local to regional maize yields and total production in the US Corn Belt?," published in the June 2016 Field Crops Research.
To watch a media interview about the yield forecasts on 10-11 Now’s Pure Nebraska, visit: http://www.1011now.com/content/news/Predicting-crop-yields-384882981.html
