June 6, 2008
A Factor in Irrigation Management
Evapotranspiration (ET) can be defined as the loss of water from the ground, lake or pond, and vegetative surfaces to the atmosphere through vaporization of liquid water. In agro-ecosystems, ET is the sum of two terms:
- transpiration, which is water entering plant roots and used to build plant tissue or being passed through leaves of the plant into the atmosphere in the vapor form, and
- evaporation, which is water evaporating from soil and plant leaves. Water accumulation on plant leaves can be due to dew formation or interception of water from rainfall and/or irrigation.
|
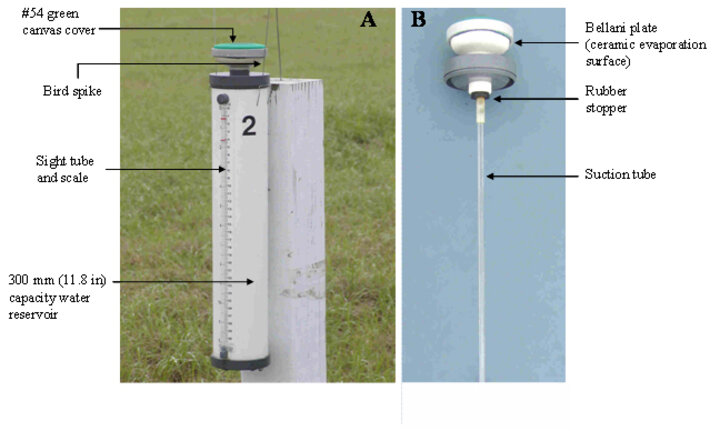
| Figure 1. Model A ETgage at 40 inches above ground in a pasture field (A) and some of the basic components of the gage (B). |
|
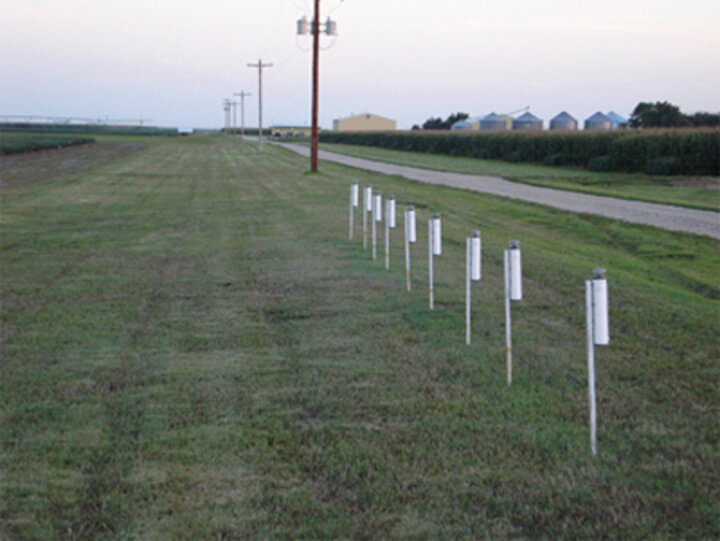
| Figure 2. Typical installation of the ETgages by the service road about 50-69 ft from the crop field in an open area at the UNL South Central Agricultural Laboratory near Clay Center. |
|
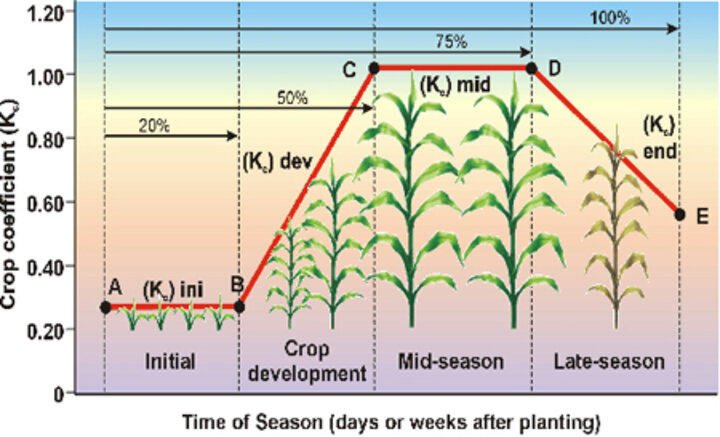
| Figure 3. Schematic representation of crop coefficients for corn during initial, development, mid-season, and late season growth stages. |
ETc = ETref x Kc
where ETc is the crop ET (crop water use) in units of water depth (inches/day),
ETref is the alfalfa-reference ET (inches/day) as calculated from the basic weather variables (solar radiation, air temperature, wind speed, and relative humidity) measured with a weather station. Reference ET can also be obtained from the ETgages.
Description of Atmometers (ETgage)
The ETgage is a practical and accurate tool that measures ETref. ETgage is a modified atmometer that consists of a canvas-covered ceramic evaporation plate mounted on a water reservoir (Figure 1). The reservoir capacity is 11.8 inches as water depth. The fabric covering creates a diffusion barrier (resistance) that controls the evaporation rate similar to that found in healthy leaves in a well-watered plant community. The green canvas cover (Gore-Tex) that surrounds the ceramic plate mimics the radiation absorption of the plant leaves. In theory, the diffusion barrier of the canvas cover and the canopy surface resistance of healthy, actively growing, green, and well-watered vegetation are "assumed" to be similar. Typical installation of an ETgage is shown in Figure 2. For information on operational characteristics of ETgages and how they can be used for irrigation management, see the UNL NebGuide, Using Modified Atmometers (ETgage) for Irrigation Management .
Crop Coefficient Concept
The Kc or crop coefficient for a given crop is usually determined experimentally. The Kc values represent the integrated effects of changes in leaf area, plant height, crop characteristics, irrigation method, rate of crop development, crop planting date, degree of canopy cover, canopy resistance, soil and climate conditions, and management practices. Each agronomic crop has a set of specific crop coefficient and will predict different water use rates for a specific crop for different growth stages. An example of a Kc curve as a function of days or weeks after planting is given in Figure 3.
In general, crop growth stages can be divided into four main growth stages; initial, crop development, mid season, and late season. The length of each of these stages depends on the climate, latitude, elevation, planting date, crop type, and cultural practices. Local field observations are best for determining the growth stage of the crop so adjust the empirical Kc values accordingly.
Early in the growing season during the crop germination and establishment stage, most evapotranspiration occurs as evaporation from the soil surface. As the crop canopy develops and covers the soil surface, evaporation from the soil surface decreases and the transpiration component of evapotranspiration increases. Early in the season when plants are small, the water use rate and Kc value also are small (Kc initial stage) and the crop ET rate increases as the plant develops (Figure 3). For agronomical plants, the crop ET rate is at the maximum level when plant is fully developed (Kc mid-season). The ET rate decreases again toward the end of the season when the plant completes development and reaches physiological maturity (Kc end season).
For perennial crops a similar pattern can occur as the plant starts to develop canopy area, grow new shoots and develop fruit. The percentage of leaf area, soil water status, and climatic conditions will drive the rate of crop (ET) at a given growth stage. Usually, the maximum canopy cover coincides with the time of year when the solar radiation and temperature are at their peak values (usually mid-season in July and August) and the maximum ET therefore occurs during that period. Kc values for many crops have been published. More information on crop coefficients for corn, soybeans, sunflower, edible beans, grain sorghum, winter wheat, etc. are available on the CropWatch Weather site under Et Resources.
Suat Irmak
Extension Water Resources Engineer
NAWMDN Team
