April 27, 2007

| Table 1. Yields from the long-term tillage study in 2006, the yield increase over the clean-tilled moldboard plow system, and the calculated water savings over the clean-tilled system based on three extra bushels per extra inch of available water. | |||
| Treatment |
Yield (bu/ac) |
Increased Yield (bu/ac) |
Water Saved (inches) |
| Plow | 43.2 | 0.0 | 0.00 |
| Chisel | 55.7 | 12.5 | 4.17 |
| D-Disk | 56.2 | 13.0 | 4.33 |
| Disk | 58.9 | 15.7 | 5.23 |
| NT w/C | 61.5 | 18.3 | 6.10 |
| No-till | 62.0 | 18.8 | 6.27 |
| Table 2. Yields from the long-term tillage study in 2000, the yield increase over the clean-tilled moldboard plow system, and the calculated water savings over the clean-tilled system based on three extra bushels per extra inch of available water. | |||
| Treatment |
Yield (bu/ac) |
Increased Yield (bu/ac) |
Water Saved (inches) |
| Plow | 23.2 | 0.0 | 0.00 |
| Chisel | 36.2 | 13.0 | 4.33 |
| D-Disk | 36.1 | 12.9 | 4.30 |
| Disk | 41.8 | 18.6 | 6.20 |
| NT w/C | 43.8 | 20.6 | 6.87 |
| No-till | 47.7 | 24.5 | 8.17 |
Producers often ask how much water is conserved when using conservation tillage or no-till systems. That answer varies depending on several factors, including:
- How intense is the rainfall?
- How often does it occur?
- How much residue cover is on the soil surface?
- How much water can the soil store?
- Are there growing crops to use the water when it's available?
- Will enough water be available during critical growth stages?-and many more factors.
(See Use No-till and Residue to Conserve Soil Moisture and Residue Reduces Soil Moisture Evaporation in the April 21, 2006 issue of CropWatch.)
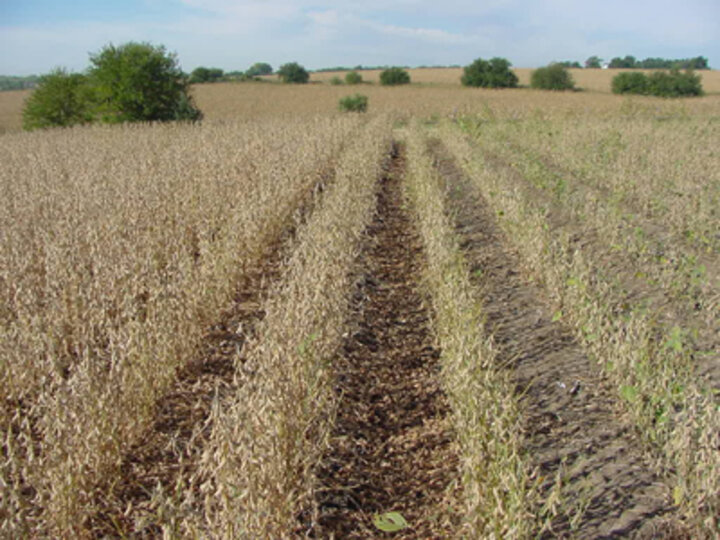
Rainfall during the 2006 growing season was below normal in many areas of the state. Soybean trials in the long-term tillage study at the Rogers Memorial Farm showed improved yields with increasing levels of crop residue. The highest yields were from the no-till system (see No-till leads yields in long-term tillage field comparison in the November 22, 2006 issue of CropWatch). These plots were planted into residue from a 190 bu/ac corn crop in 2005. While the 2006 season started with a full soil moisture profile, only about 8.9 inches of rain fell during the growing season.
Irrigation research has shown that soybeans have a fairly linear response to water of around 3 extra bushels produced for every inch of irrigation water applied. Using this assumption and the yields from the long-term tillage study, the water savings for each of the tillage systems compared to the clean-tilled plow system were calculated (Table 1). The conservation tillage systems "saved" 4 to 5 inches of water, with the no-till systems "saving" over 6 inches. While based on a rough estimate, this savings is similar to what some producers report that they feel they have with their no-till systems.
A similar analysis for the 2000 crop year for these same plots (Table 2) showed 4 to 6 inches of water "saved" with the conservation tillage systems and about 8 inches "saved" with no-till compared to the clean-tilled plow system. The 2000 crop year started with only about two-thirds of a soil moisture profile and had about 13.8 inches of rainfall during the growing season. However, there was a major difference in the timing of the rainfall events between the 2000 and 2006 growing seasons. In 2006, there were about 5.5 inches of rainfall during the critical pod-filling growth stage compared to less than 1.5 inches in 2000, explaining the majority of the difference in yields between the two years. Also, the 2000 soybeans were planted into less residue — that from 120 bu/ac grain sorghum in 1999.
The water savings would probably be greater the more often it rained as there would be less evaporation with the increased residue cover. In addition, the water savings would be greater with more intense rainfall events as there would be less crusting with residue cover and better infiltration with improved no-till soil structure resulting in less runoff. However, in eastern Nebraska, the yields may not always reflect the water savings as we often have more water than the crop needs. That's why the relatively dry years of 2000 and 2006 are interesting to look at. The further west in the state you go, the more often the water savings will show up.
Paul Jasa
Extension Engineer
