Soil Moisture Update
July 6, 2015
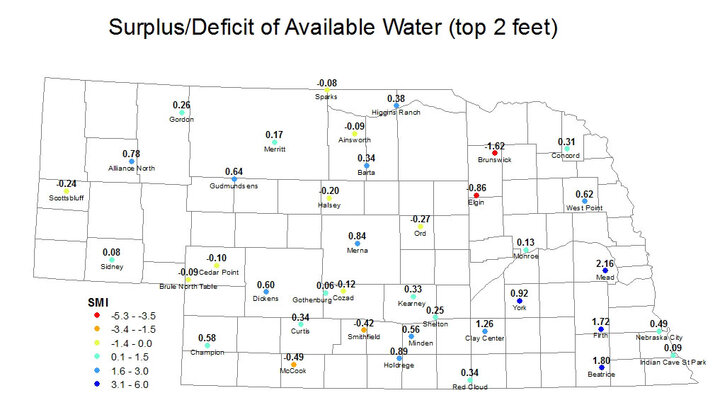
The latest soil moisture index maps (Figures 3-4) reveal soils are continuing to dry across most of the state and 12 sites are now below a soil moisture index of 0.0: Ainsworth, Brule North Table, Brunswick, Cedar Point, Cozad, Elgin, Halsey, McCook, Ord, Scottsbluff Smithfield, Sparks. For the first time all year, there are red dots on the map (Brunswick and Elgin), which denote the lowest/driest SMI category. However, the SMI is relatively close to 0.0 at most sites and would be brought above the 50% mark with one decent rain.
There are still several sites in the state, particularly in the prime corn growing areas in east central Nebraska, that are quite moist. Moist soils and several predicted cool nights in that region bode well for the corn crop as it starts to head into pollination.
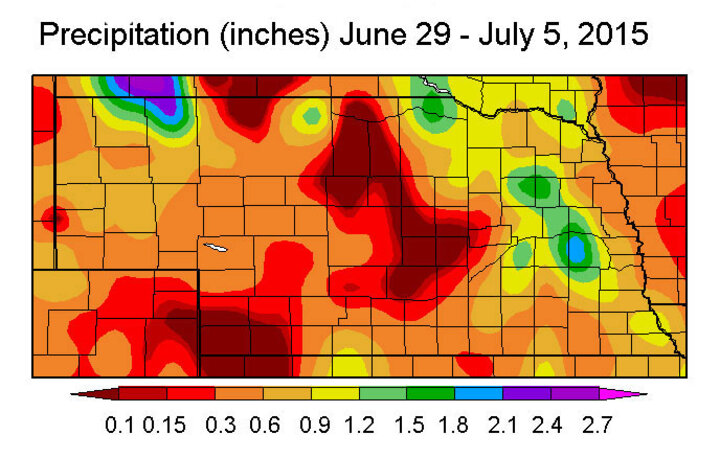
According to the national Weather Prediction Center (Figure 2), rainfall of up to half an inch is possible across much of the state over the next seven days, with slightly less projected in the northeastern Sandhills where the rain is needed most. With cooler than average temperatures projected for midweek, potential evapotranspiration will remain lower, which should help prevent major depletion of soil moisture for the first half of the next week. Hotter temperatures should return by the weekend, so areas that are currently in deficit will likely remain so into next week if they don't receive one-half to one inch of rain Thursday or Friday.
Average Soil Moisture Index by USDA NASS Crop District
(Districts and EPA Ecoregions Defined)
Northwest (District 10): 0.6
North Central (District 20): 0.4
Northeast (District 30): -1.4
Central (District 50): 0.5
East Central (District 60): 3.1
Southwest (District 70): 0.8
South Central (District 80): 0.7
Southeast (District 90): 2.0
Note: The Soil Moisture Index (SMI) is based on the estimated field capacity and wilting point at three depths (10 cm, 25 cm, 50 cm) at Automated Weather Data Network (AWDN) sites under grass cover. The index may not necessarily be representative of conditions of a nearby field, particularly if differences in total precipitation over the previous week have been significant.
Eric Hunt
High Plains Regional Climate Center
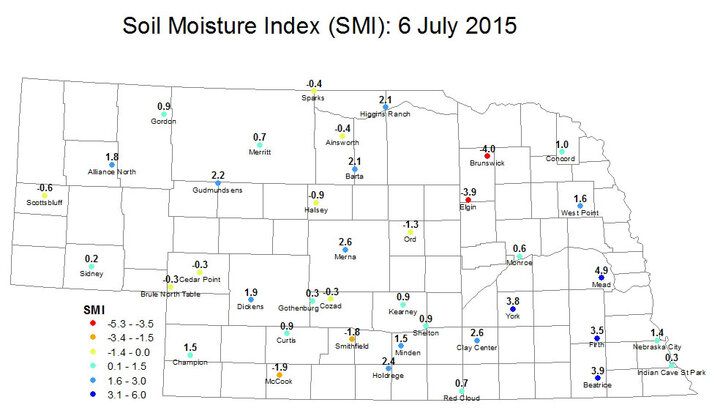
Figure 3. Soil moisture index in the top 0-50 cm of soil.