Soil Moisture Update
July 20, 2015Conditions turned drier last week with the soil moisture index for five of the eight sites listsed below decreasing.
Eric Hunt
High Plains Regional Climate Center
| Table 1. Average Soil Moisture Index by USDA NASS Crop District. (Districts and EPA Ecoregions Defined) The number in parentheses shows the change from the previous week. | ||
| Northwest | - 0.9 | (-1.2) |
| North Central | 0.5 | (-0.6) |
| Northeast | 0.1 | (+0.6) |
| Central | -0.3 | (+0.7) |
| East Central | 1.9 | (-0.6) |
| Southwest | -0.5 | (-0.4) |
| South Central | -0.7 | (-0.6) |
| Southeast | 1.4 | (+0.2) |
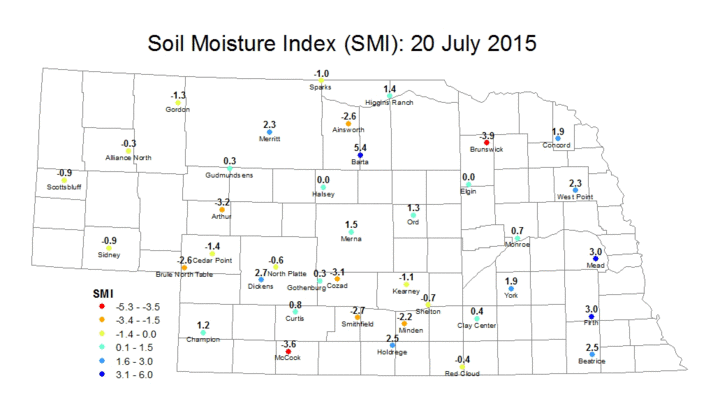
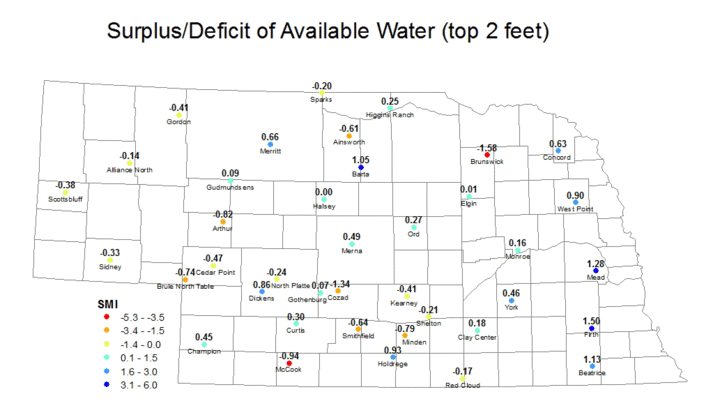
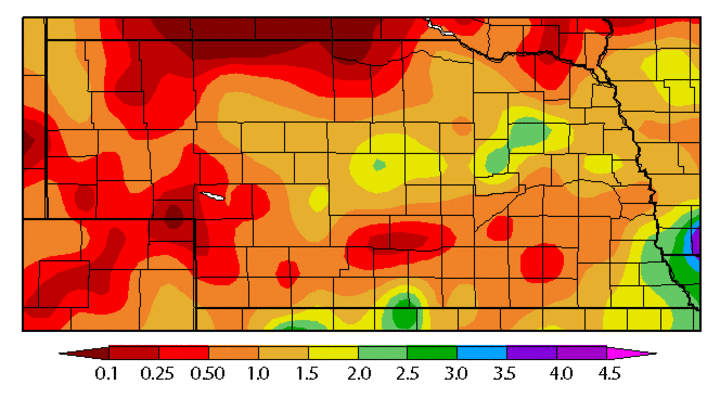
Figure 3. Soil moisture index in the top 0-50 cm of soil.