Soil Moisture Update
June 29, 2015
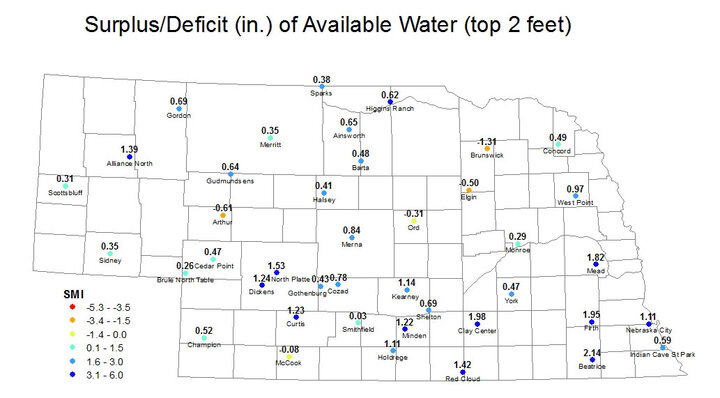
For the first time this year, most locations in the state saw under an inch of precipitation and several locations saw no precipitation in the last week. The dry week is evident in the latest SMI map as there are now five stations across the state with an SMI below 0.0. Last week there were two and there were none the week before that. Several others, particularly in the Panhandle and southwest, will join the list next week if precipitation doesn't materialize.
Nevertheless, most locations around the state are still fairly moist as we head into July. Division averaged SMIs are safely above 0.0 for all but the northeast, which is skewed a bit by the dryness around Brunswick and Elgin. Precipitation is not guaranteed for most locations but scattered thunderstorms are probable mid-week, especially in the east. It might even be a welcome rain for some of the areas that missed out on rain over the past 10 days. That's the first time that has been the case since planting began in April, but if recent July's are any predictor of July precipitation for this year, it won't be the last time that is the case.
Average SMI by USDA NASS Crop District
(Districts and EPA Ecoregions Defined)
Northwest (District 10): 1.8
North Central (District 20): 1.7
Northeast (District 30): -0.4
Central (District 50): 1.7
East Central (District 60): 2.5
Southwest (District 70): 2.1
South Central (District 80): 2.4
Southeast (District 90): 3.4
Note: The Soil Moisture Index (SMI) is based on the estimated field capacity and wilting point at three depths (10 cm, 25 cm, 50 cm) at Automated Weather Data Network (AWDN) sites under grass cover. The index may not necessarily be representative of conditions of a nearby field, particularly if differences in total precipitation over the previous week have been significant.
Eric Hunt
High Plains Regional Climate Center
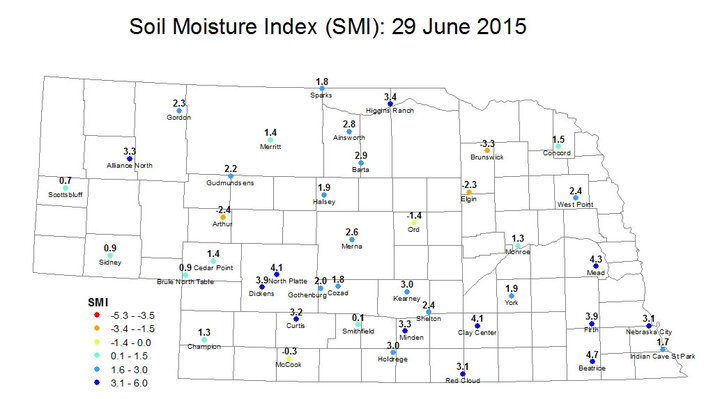
Figure 2. Soil moisture index in the top 0-50 cm of soil.