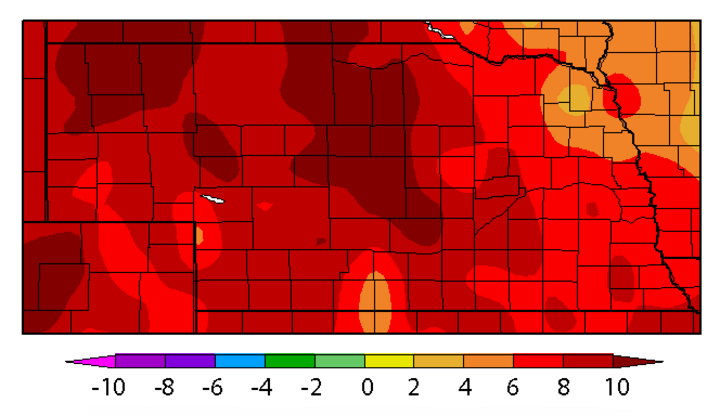
Well above normal temperatures continue to dominate the western two-thirds of the United States, a trend that has been in place since our Groundhog Day blizzard event. The strongest warmth has been felt over the past two weeks with daily temperatures as much as 25 degrees Fahrenheit above normal. Figure 1 shows that average temperatures for the past 30 days were 8-10 degrees above normal across the western three-fourths of the state, while eastern areas are averaging 6-8 degrees above normal.
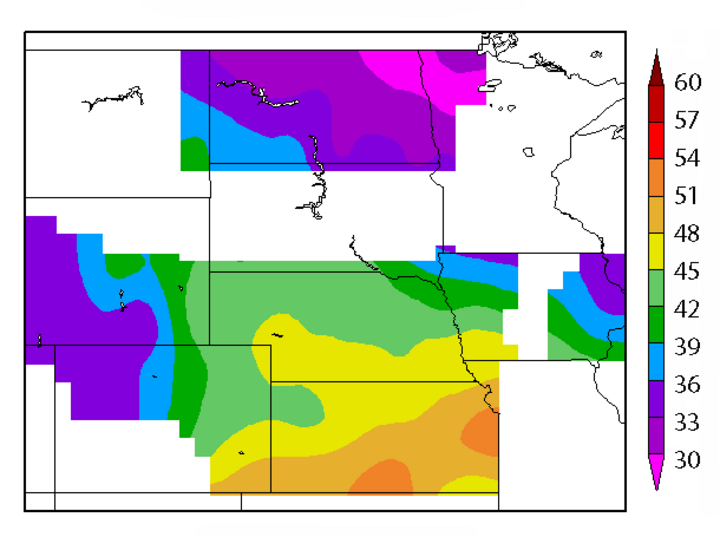
Soil temperatures have begun to respond to the recent warming trend (Figure 2). In general terms, soil temperatures at the 4-inch depth under bare soil in the southern half of Nebraska averaged between 45°F and 48°F for the past seven days, while the northern half averaged between 42°F and 45°F. This would suggest that soil temperatures under sod are running in the upper 30s across extreme northern Nebraska and lower 40s across southern Nebraska.
All of this warmth can be directly tied to a shift in the jet stream pattern that favored a mean long wave upper air trough pattern over the eastern United States. At the same time, El Nino storms entering the west coast subsided, resulting in dry conditions across the western half of the U.S., including Nebraska. El Nino-fueled storms began on the west coast last week, so we will see whether the aggressive storm pattern experienced from December through early February redevelop.
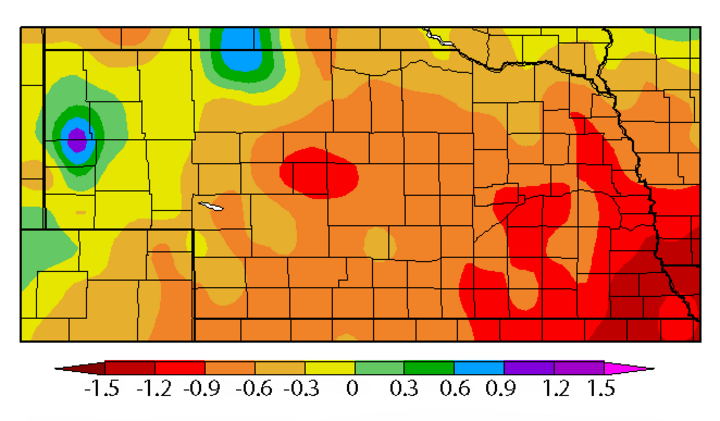
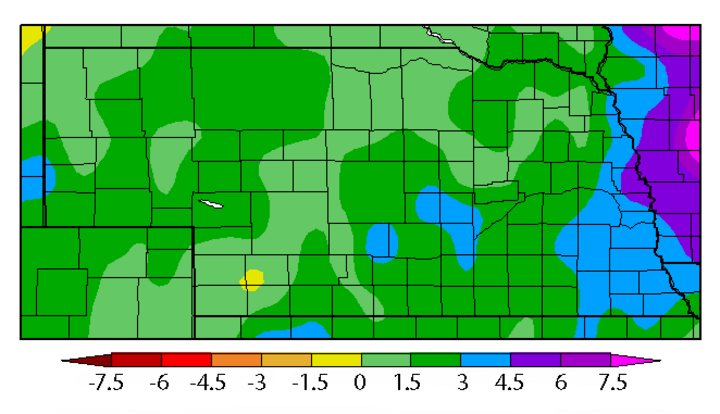
Here in Nebraska, the precipitation trend the past 30 days (Figure 3) was toward substantial dryness, with less than 0.10 inch of moisture for areas east of the Panhandles and southeast of the northeastern corner of the state. Precipitation departures are 0.3 to 1.5 inches below normal, with the largest deficits in southeast Nebraska (Figure 4). The good news is that the recent dryness has not significantly reduced the surplus moisture gained during the soil moisture recharge period that began in October (Figure 5).
While the recent dry spell has allowed producers to apply nitrogen and repair fields from last year's storm damage, it's also leading to concerns that wheat and alfalfa breaking dormancy will be susceptible to freeze damage during the second half of March through early April. If the trend the past two weeks continues through the next two weeks, there's a high probability that native vegetation would break dormancy.
Weather models are currently pointing toward a much cooler pattern during the second half of March. A series of strong storms has been forecast to enter the western U.S. at the same time Canadian air has been forecasted to surge into the central Plains. If this does verify, a complete dormancy break would be delayed. However, the weather models have been hinting at this stormy pattern for a couple weeks and it has failed to materialize for most of the central High Plains region.
The most recent weather models hint at another strong storm entering the western U.S. this weekend, impacting Nebraska March 14-16 with rain the primary threat and light snow accumulations on the backside of the exiting low. The same weather models indicate air temperatures will likely cool back into the 40s once the system moves northeast of the area.
Additional strong storms are projected to enter the western U.S. next week, moving into the central Plains March 20-22. The current storm track projection indicates that enough cold air will be in place to generate accumulating snowfall, with the western half of Nebraska the most likely area to see significant accumulations. Another strong storm system entering the western U.S. is projected to arrive March 24-26. Weather models indicate it may bring another opportunity for accumulating snowfall for western Nebraska. March may indeed exit like a lion this year.