Patricio Grassini, Associate Professor of Agronomy and Horticulture, Extension Cropping System Specialist and Water for Food Institute Fellow; Jose Andrade, UNL Research Assistant Professor of Agronomy and Horticulture; Juan Ignacio Rattalino Edreira, Research Assistant Professor; Gonzalo Rizzo, UNL Ph.D. Student; Haishun Yang, Associate Professor of Agronomy and Horticulture and Water for Food Institute Fellow; Keith Glewen, Extension Educator, and Jennifer Rees, Extension Educator; Jeff Coulter, Professor and Extension Specialist, University of Minnesota; Mark Licht, Extension Cropping System Agronomist, and Sotirios Archontoulis, Assistant Professor, both at Iowa State University; Ignacio Ciampitti, Crop Production and Cropping System Specialist and Assistant Professor of Agronomy, Kansas State University; Ray Massey, Extension Professor, University of Missouri; Peter Thomison, Extension Specialist and Professor, Ohio State University

This article summarizes the simulated crop stages and yield forecasts performed on August 21 for 37 locations across the US Corn Belt; the data can be viewed here. Details on the underpinning methodology to simulate phenology and forecast end-of-season yields, as well as on interpretation and uses of yield forecasts, are described in a previous article.
During the last three weeks, weather was highly erratic across sites, with rainfall and solar radiation below normal at most sites in Iowa and Nebraska, respectively. A summary of weather conditions during the last three weeks is shown in Figure 1.
Simulated Corn Stage across 37 Locations
Corn has reached dough stage at most locations, except for irrigated corn in western and north-central Nebraska, northern sites in North Dakota and Minnesota, and the eastern fringe of the region (Indiana, Michigan, and Ohio) (Figure 2). These sites are still at milk or even silk stage.
Most Kansas and southeast Nebraska sites are between dent and physiological maturity (black layer stage). In southern Kansas, corn has reached physiological maturity. While the probability of an early killing frost in 2019 is higher than in a normal year due to late planting, the chance of a killing frost is greater than 25% (one chance out of four) in only 15% of the sites ( Table 1).
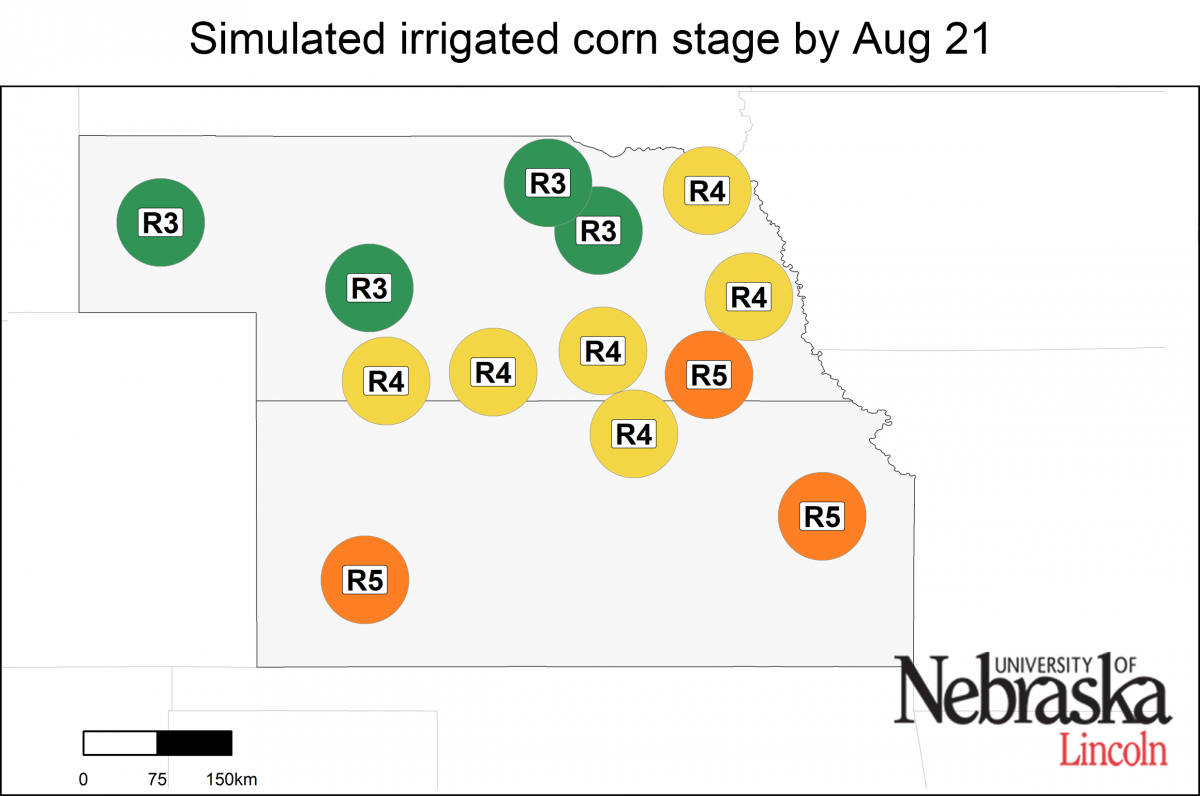
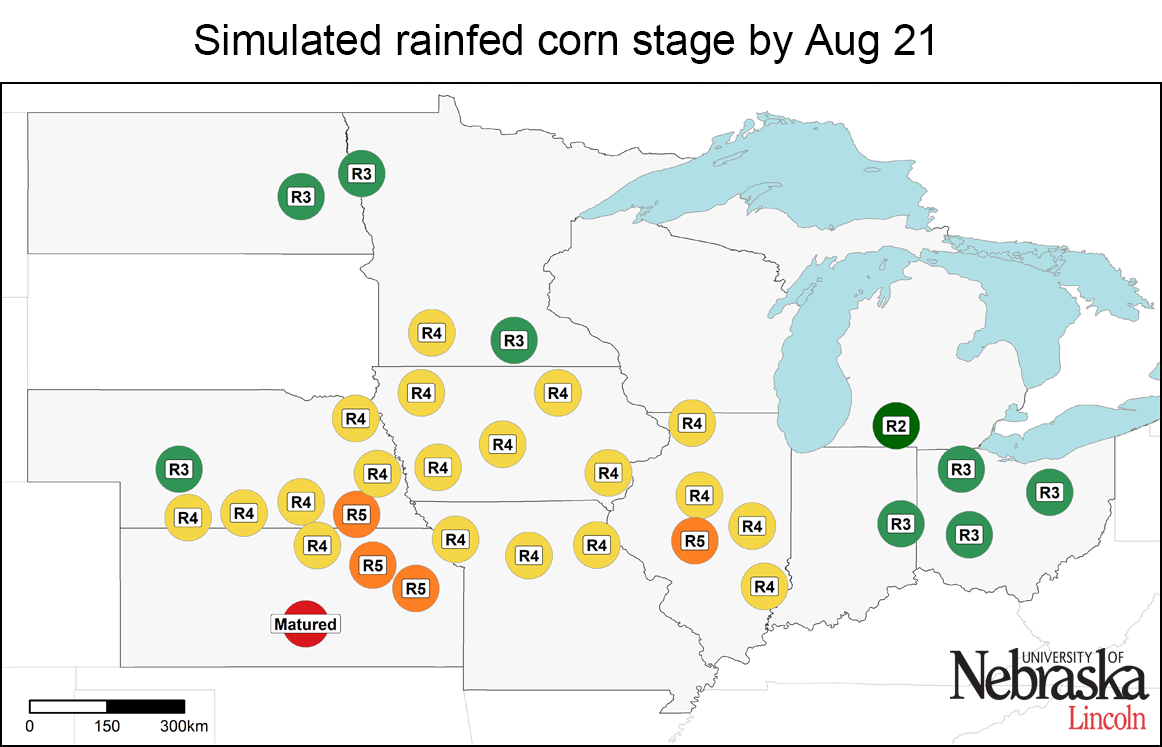
Figure 2. Simulated developmental stage for irrigated and rainfed corn at each location. R1: silking; R2: blister; R3: milk; R4: dough; R5: dent; physiological maturity: matured.
Irrigated Corn: Near Or Above-Average Yields
The range of forecasted irrigated corn yield potential for each location, as well as the probabilities for yields above, near, or below average, are shown in Figures 3 and 4 and in Table 1. There is a relatively small chance (less than 25%; that is, a less than one in four) to have below-average yield potential across all irrigated sites. The chance of getting below-average yield is mostly associated with an early killing frost in the fall which, as mentioned in the previous report, has increased in northeastern Nebraska. Relative to the previous forecast, the chance of near-average yield potential has increased and only one site in northeast Kansas exhibits a high probability (more than 75%, that is, three out of four chances) of above-average yield potential.


Figure 3. Vertical lines indicate the range of forecasted 2019 corn yield potential by August 21, based on average 2019 planting date at each location. Horizontal lines indicate the 25th and 75th percentiles of the yield distribution (associated with respective adverse and favorable weather scenarios during the rest of the season). The blue squares indicate the long-term (2005-2018) average yield potential at each location and the red dots represent the forecasted 2019 corn yield potential at sites that have already reached maturity. Separate charts are shown for irrigated corn and rainfed corn.
Rainfed Corn: Low Probability of Below-average Corn Yields in 2019
The scenario for rainfed yield potential looks favorable for most of the Corn Belt (Figures 3 and 4). There is a high probability of above-average yield (more than 75%) at 19 sites, mostly located in the western fringe of the region (Nebraska, Kansas, and North Dakota) and also in Missouri, western Iowa, southwestern Minnesota, and central Illinois. Other sites in Iowa exhibit a high probability of near-average yields.
The scenario is less clear for the other rainfed sites in the eastern fringe of the region, although it seems that the chance of below-average yields is relatively low, except for southern Illinois. Abundant and well-distributed rainfall in most of the region has determined a high probability of near or above-average yields at many sites despite crop development that’s running behind last year.


Figure 4. Probability of the 2019 yield potential to be below (10%, green color) the long-term (2005-2018) average yield potential at each location. Separate maps are shown for irrigated corn and rainfed corn. The larger a color section is within the pie chart, the higher the probability that end-of-season corn yield will be in that category.
Conclusions
Corn has already reached dough stage in most parts of the region except for the eastern fringe and a few sites in the western region. For both rainfed and irrigated corn, there is a low probability of below-average yields at the majority of the sites. For rainfed corn, above-average yields are expected for 19 locations, mostly located in Nebraska, Kansas, North Dakota, Missouri, and western Iowa while near-average yields are expected in Iowa. Forecasts are less clear for the eastern fringe of the region: temperature and rainfall during the rest of the season will determine the final yield.
These forecasts do not take into consideration problems with stand emergence, hail/flooding damage, replanting situations, disease, or nitrate leaching. In fields negatively affected by these constraints, actual yields will be lower than estimates provided here. It is important to keep in mind that yield forecasts are not field-specific and, instead, represent an estimate of average on-farm yield for a given location and the surrounding area in absence of the yield-reducing factors mentioned here. Likewise, crop stages and forecasted yields will deviate from the ones reported here in fields with planting dates or hybrid maturities that differ markedly from those used as the basis for the forecasts. We will follow up with the final forecasted yield and analysis of the 2019 crop season on Sept. 17.
