2015-Crop-Ins-Prices
2014 Crop Insurance Projected Prices
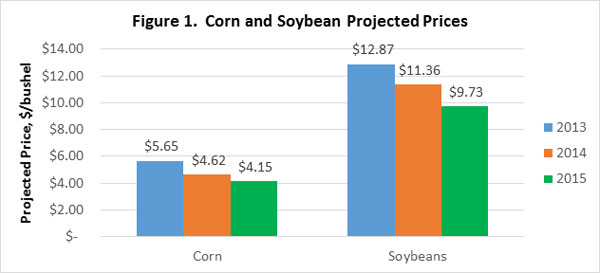
The Risk Management Agency (RMA) uses the futures market to determine crop insurance projected prices. Average futures settlement prices during February determine both corn and soybean projected prices. Projected prices for 2015 are $4.15/bushel for corn and $9.73/bushel for soybeans. Compared to last year, prices are down $0.47/bushel for corn and $1.63/bushel for soybeans (Figure 1). From two years ago prices are down $1.50/bushel for corn and $3.14/bushel for soybeans. The impacts of lower projected prices are twofold. First, crop insurance revenue guarantees will decrease for the second time in two years. Second, producer paid premiums will also decrease.


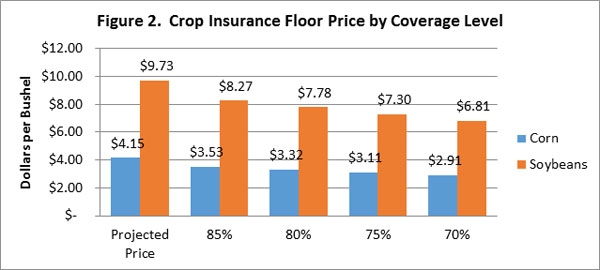
If we hold yields constant at Actual Production History (APH) levels, we can calculate the crop insurance price floor (i.e., implied put price) using projected prices. We do this for both corn and soybeans in Figure 2. For example, with corn using an 85% coverage level the crop insurance price floor is $3.53/bu ($4.15/bu * .85 coverage level). If a producer's harvested bushels equal APH bushels, an indemnity would be paid if the harvest price falls below $3.53/bu.
As coverage levels decline, the crop insurance floor price also declines, reducing the probability of an indemnity being paid. As a result, higher coverage levels increase the probability of payments and the potential for larger payments, which in turn means higher premiums. Producers must balance the higher probability of payments with increases in premiums. For corn, each 5% decline in coverage level reduces the crop insurance price floor by $0.21/bushel and premiums decline. For soybeans, each 5% decline in coverage level reduces the crop insurance price floor by $0.49/bushel and premiums decline.
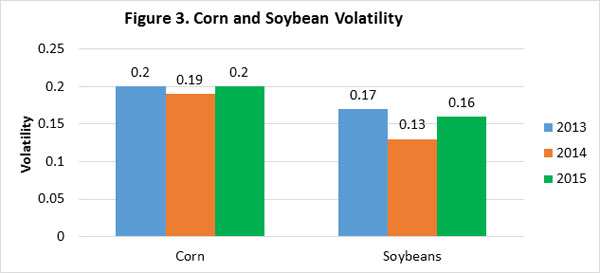
In addition to calculating projected prices, the RMA also determines the price volatility. Volatility is a measure of variation around an asset (the projected price), where a higher value implies more risk and a lower value indicates less risk. Price volatility is important because it's a component used in determining premiums, where lower volatility implies lower premiums. For 2015, price volatility for corn is 0.2 and for soybeans it is 0.16 (Figure 3). Compared to last year, corn price volatility is up 0.01 for corn and up 0.03 for soybeans. Higher volatility implies more uncertainty where prices will end up this fall and therefore an otherwise higher premium. The overall effect on premiums will depend on whether the lower projected price more than offsets the increase in volatility from a year ago.
Cory Walters
Extension Crop Economist
Monte Vandeveer
Extension Educator
Online Master of Science in Agronomy
With a focus on industry applications and research, the online program is designed with maximum flexibility for today's working professionals.
