The past week began with hot dry conditions statewide, which allowed for some much-needed drying of the soil profile at all locations. The reprieve from the abnormally wet warm season was short-lived, however, especially for the eastern third of the state, as significant precipitation returned Wednesday night. Flooding was a problem yet again for parts of the Big Blue watershed and southern Lincoln.
Updates by USDA NASS Crop District
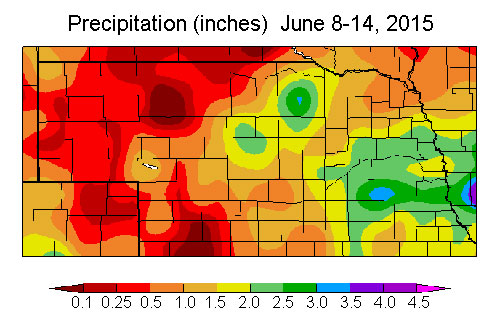
Figure 1. Almost all areas of the state received some rain in the past week with southeast Nebraska and a pocket in the north central area receiving 2-3.5 inches. (Source: High Plains Regional Climate Center)
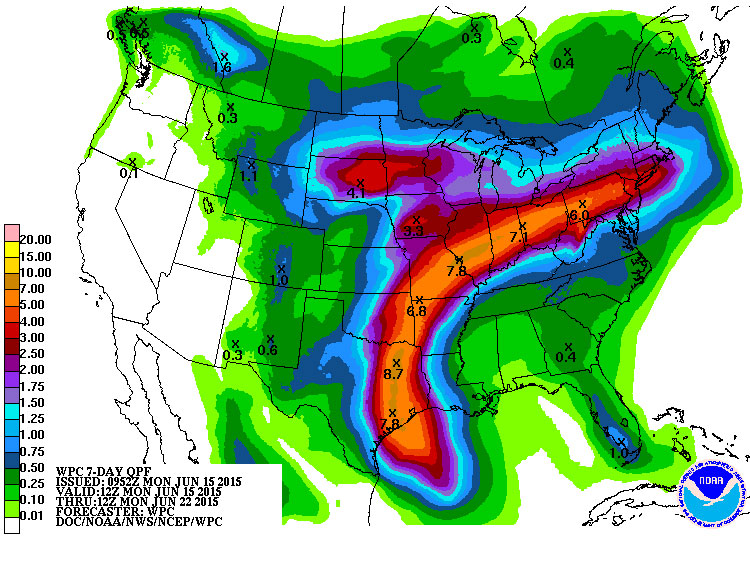
Figure 2. Precipitation forecast for June 15-22, 2015, indicates Nebraska will miss the brunt of the high precipitation events. (Source: Weather Prediction Center)
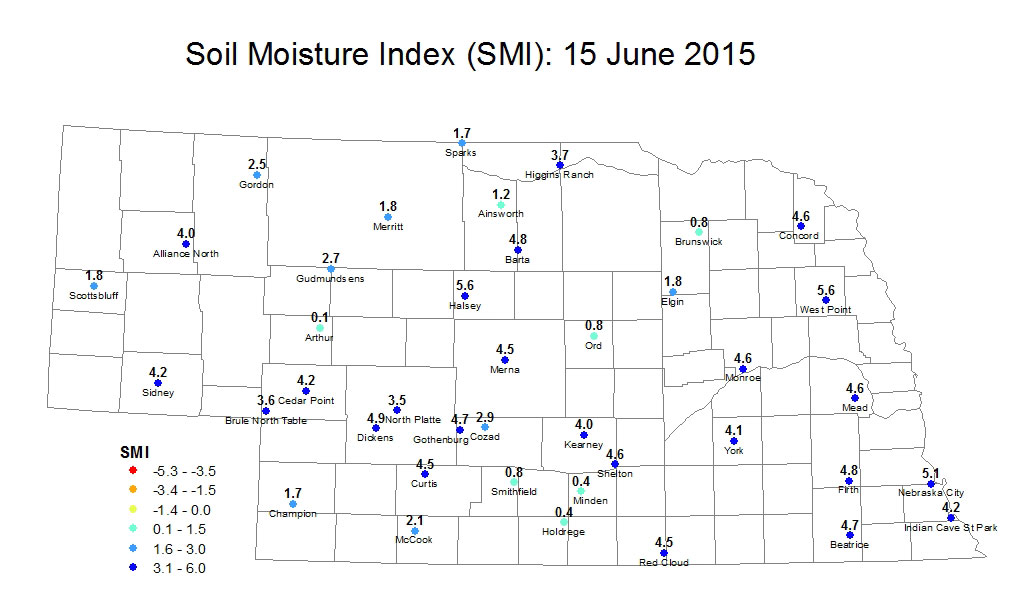
Northwest (District 10): Conditions were dry — a change for this season — throughout much of the Panhandle. Some precipitation is expected this week but warm temperatures later in the week could offset this. Average SMI: 3.1
North Central (District 20): A week with lower rainfall totals allowed soils to dry across the Sandhills and SMI levels have fallen below the field capacity level at all sites except Halsey. The Arthur site is close to going below 0.0 for the first time this season and a few other sites in that region could be below 0.0 by this time next week if the forecasted precipitation doesn't pan out. Average SMI: 2.7
Northeast (District 30): Hot, dry weather early in the week was followed by 1-2 inches of precipitation in many areas, with plenty more falling early Monday morning (after the cutoff for this report). The western portion of the district noted improvements in the SMI over the previous week, partciularly at Brunswick. Additional precipitation is expected later this week. Average SMI: 3.2
Central (District 50): Most areas saw between 1.0-1.5 inches of rain over the past week and soils remain moist. Precipitaiton is expected this week, though most locations should see just 0.5 inch or less. Average SMI: 3.2
East Central (District 60): Hot and dry early in the week, with significant precipitation Wednesday night into Thursday and then again in some places Sunday afternoon. More rain is possible most days over the next week. Average SMI: 4.4
Southwest (District 70): Most places saw less than 0.5 inch of precipitation and soils dried a bit, though they are still favorably moist. Precipitation is expected to be minimal across southwestern Nebraska this week with seasonably hot weather expected by week's end. Average SMI: 3.5
South Central (District 80): The district remains the driest in the state but is still fairly moist as most places saw 0.5-1 inch of precipitation over the past week. Chances for storms exist all week, though widespread totals over an inch do not look likely. Seasonably hot weather is also expected at the end of the work week. Average SMI: 1.5
Southeast (District 90): As in the East Central district, the hot dry weather early last week was short-lived and most places received an additional 2-3 inches of rain between Wednesday and Sunday nights. This was not particularly welcome, especially in the Big Blue watershed where flooding has been a problem. Additonal precipitation of an inch or more over the coming week is a good possibility, so widespread drying is not likely. Average SMI: 4.6.
What is the Soil Moisture Index (SMI)?
The SMI is based on the estimated field capacity and wilting point at three depths (10 cm, 25 cm, 50 cm) at Automated Weather Data Network (AWDN) sites under grass cover. The index may not necessarily be representative of conditions of a nearby field, particularly if differences in total precipitation over the previous week have been significant. Generally, a rating of 5 indicates the soil is at field capacity.