Strong El Nino Now Expected this Fall
July 23, 2015
In case you missed it, national news organizations have been ramping up coverage of the current El Nino event that is rapidly intensifying in the Equatorial Pacific. The latest three-month (April-June) sea surface temperature anomaly for this region was 0.9°C above normal. Based on the Climate Prediction Center table of past El Nino and La Nina events, there have been only three instances since 1950 when temperature departures have been this large during April-June.
Looking back at historical CPC records, an April-June temperature departure reading of 1.0°C was recorded in 1983 and 1992, while 1987 came in at 0.9 °C. It should be noted that the 1983 and 1992 events were decaying and had disappeared before the end of the summer. The 1987 value represented the low value between the peaks of the 1986-87 and 1987-1989 back-to-back El Nino events.
The strongest El Nino recorded since 1950 occurred during 1997-98 and had a subsequent basin average sea surface temperature departure of 0.6°C above normal for the comparable April-June period. Our current El Nino event is 0.3°C warmer than this record-setting event and forecasted to be one of the strongest, if not the strongest El Nino is our climatological data base.
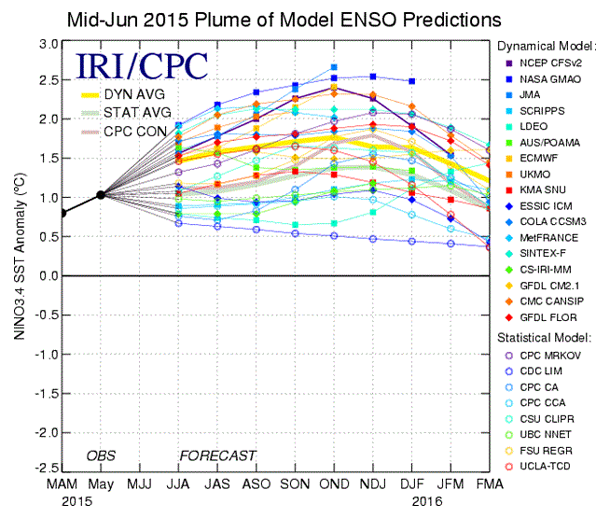
CPC's latest El Nino advisory indicates that mean peak of this El Nino is forecasted to occur during the October-December (Figure 1). The peak temperature deviation estimate by the 25 models used to forecast El Nino indicates an average of 1.7°C above normal. The 1997-98 event peaked out at 2.3°C above normal, but at least five of the models used for projecting this El Nino's peak show a cooling trend moving forward. Throw these five projections out and the average peak deviation value increases to 2.0°C above normal.
We already seeing early signs of environmental relationships usually found with strong El Nino events. Hurricane activity has been able to move much further northward in the eastern Pacific than normal bringing rainfall to southern and central California. The southwest monsoon season has brought heavy rainfall and flash flooding to the lower Great Basin region. Pacific crab species that are usually found well south California are covering beaches as they wash ashore.
Based on available information, there is a high probability that California will experience a very aggressive precipitation pattern through spring 2016 and significant recovery to the lower Colorado River system is likely. As we move into late fall and winter, the southern Plains will likely experience wet conditions and periodic bouts of severe weather in the form of rain, snow, and ice.
Potential Impact on Nebraska
El Nino statistics indicate that Nebraska lies at the intersection of two dominant weather patterns. To our south, below normal temperatures and above normal precipitation occur over 70% of the time during an El Nino. The dominant pattern across the Dakotas and south central Canada is above normal temperatures and below normal precipitation. El Nino events strengthen the subtropical jet stream and weaken the northern jet stream. Cold air outbreaks are less frequent with short time spans as the northern jet remains displaced across central Canada. The subtropical jet strengthens and sends energy through the southern U.S. resulting in abundant rainfall and cloud cover. It is not uncommon to see a zone of frequent ice accumulations north of the surface low as warm air rides over top of cooler surface air masses. This area is typically centered somewhere within the region of northern Texas through extreme southern Nebraska.
Stronger El Nino events generally last longer into the spring than weak events. We can see significant late winter and early spring precipitation events here in the Central Plains, as evidenced in the El Nino statistical tendency link listed below. If the El Nino event remains active heading into summer 2016, drier than normal conditions will likely prevail across a sizeable portion of the Corn Belt east of Nebraska. The center of this dry pattern falls across southern Iowa and northern Missouri. If the El Nino begins its switch to La Nina conditions, then there is a tendency for dry conditions to develop across Nebraska during the second half of the growing season with drier than normal conditions prevailing through the fall and winter months. If soil moisture recharge is poor during this period, statistics indicate a significant increase in drought risk for the western Corn Belt for the summer following the La Nina event (2017).
How can I make such bold predictions six months before the official start of winter? CPC put together an extensive catalog of how temperatures, precipitation, and snowfall shift when El Nino or La Nina conditions are ongoing. These relationships can be found at http://www.cpc.ncep.noaa.gov/products/precip/CWlink/ENSO/composites/ Just choose the three-month period you are interested in and the variable you want to examine depending on whether we are in an El Nino or La Nina pattern.
I do want to make one point abundantly clear. The only two graphics that I have found useful within each analysis period are composite anomalies and the frequency composite maps. The remaining graphics try to apply trend analysis to past events and have failed miserably in regards to forecast accuracy. The composite anomaly is the mean trend of all El Nino events, while the frequency composite map represents the percent of time the composite anomaly has occurred.
Not only can you observe the type of conditions that are likely to occur in your area, you can observe how these patterns will impact other crop production regions. In general, the stronger the event, the more likely it is that the composite events will verify.
CPC quantifies weak El Nino events as having a basin average temperature deviation between 0.5°C and 0.99°C, while moderate events fall between 1.0°C and 1.49°C. Any event with a basin average temperature deviation of 1.50°C or greater places the event in the strong category.
Will La Nina Be Likely to Follow?
What these maps do not show is how often an El Nino event is immediately followed by a La Nina event. Table 1 lists all of the El Nino periods recorded since 1950, the peak basin average sea surface temperature anomaly, and the lowest temperature anomaly recorded within the 12-month period following the end of the El Nino event.
CPC used to define an El Nino event as three consecutive three-month periods (for example: Jan-Mar, Feb-Apr, and Mar-May) where deviations were at least 0.5°C above normal. CPC recently changed this criteria to five consecutive three-month periods of deviations of 0.5°C or greater. Using this criteria removes the very weak El Nino events. The statistics listed above are based on the old criteria.
When looking at Table 1, you will notice that 12 of the 17 El Nino events were immediately followed by La Nina conditions, based on the old criteria. With the new criteria that drops to 10 La Nina events. Until I see statistical evidence from CPC that the new criteria performs better than the old criteria, I believe it is better to use the old criteria since its forecast accuracy has averaged between 60% and 65%.
If we separate the El Nino events into their respective categories (weak, moderate, or strong), 50% of the weak events move into La Nina conditions within 12 months of the end of El Nino condition. The statistics increase dramatically for moderate and strong events, with the shift of El Nino conditions to La Nina conditions occurring in 77% of the cases, based on the historical records.
Furthermore, after the end of every El Nino event since the data began in 1950, sea surface basin averages dip below normal within 12 months. Often we hear the terms La Nada or El Nada. It is simply a reflection that the Equatorial Pacific basin has not met El Nino or La Nina conditions, but the atmosphere behaves at times like El Nino or La Nina. The El signifies El Nino like conditions are the dominant feature, while La signifies La Nina conditions are the dominant feature.
More importantly, examination of La Nina relationships demonstrates that they are usually counter to the prevailing trend of El Nino relationships for similar periods. In the eastern Corn Belt, winter precipitation trends are drier than normal during El Ninos and wetter than normal during La Ninas.
If the current El Nino follows model projections that 77% of moderate and strong events revert immediately into a La Nina using the old CPC El Nino criteria, then we will need to pay close attention to a shift toward drier climate conditions across the western corn belt and southern Plains during the second half of 2016.
An easy way to follow the evolution of global sea service temperature anomalies can be found at http://www.ospo.noaa.gov/Products/ocean/sst/anomaly/anim_6mfull.html
The end of this forecasted El Nino will likely be confirmed when colder than normal sea surface temperatures in the northwest Pacific Ocean push into the Gulf of Alaska and the northwest Pacific region shifts to above normal temperatures. It usually takes three to six months for this cold pool to work from the Gulf of Alaska south into the eastern Equatorial Pacific.
I encourage you to become familiar with the El Nino and La Nina patterns and how they impact specific regions of the country. This will provide insight into future climate conditions and help explain some of the dramatic shifts we see in weather patterns from season to season and within individual growing seasons.
Al Dutcher
Extension State Climatologist
| Table 1. El Nino periods recorded since 1950, the peak basin average sea surface temperature anomaly, and the lowest temperature anomaly recorded within the 12-month period following the end of the El Nino event and the likelihood of La Nina events based on Climate Prediction Center old and new criteria. | ||||
| Period | Maximum Value | Minimum Value | La Nina (old) | La Nina (new) |
| 1951-54 | 0.9 | -1.6 | Yes | Yes |
| 1957-59 | 1.7 | -0.3 | No | No |
| 1963-64 | 1.2 | -0.8 | Yes | Yes |
| 1965-66 | 1.8 | -0.5 | Yes | No |
| 1968-70 | 1.0 | -1.3 | Yes | Yes |
| 1972-73 | 2.0 | -1.9 | Yes | Yes |
| 1976-78 | 0.8 | -0.4 | No | No |
| 1979-80 | 0.6 | -0.4 | No | No |
| 1982-83 | 2.1 | -0.8 | Yes | No |
| 1986-88 | 1.6 | -1.8 | Yes | Yes |
| 1991-92 | 1.6 | -0.1 | No | No |
| 1994-95 | 1.0 | -1.0 | Yes | Yes |
| 1997-98 | 2.3 | -1.6 | Yes | Yes |
| 2002-03 | 1.3 | -0.2 | No | No |
| 2004-05 | 0.7 | -0.7 | Yes | No |
| 2006-07 | 1.0 | -1.4 | Yes | Yes |
| 2009-10 | 1.3 | -1.4 | Yes | Yes |
| Period: Length of the El Nino event Maximum Value: The warmest 3 month average sea surface temperature (in Celcius) deviation during the event Minimum Value: The coldest 3 month average sea surface temperature deviation within 12 months of the end of El Nino conditions La Nina (Old): CPC methodology defining La Nina as 3 consecutive running 3 month periods where sea surface temperature deviations were at least 0.5 C below normal (example: JFM, FMA, MAM) La Nina (New): CPC methodology defining La Nina as 5 consecutive running 3 month periods where sea surface temperature deviations were at least 0.5 C below normal (Example: JFM, FMA, MAM, AMJ, MJJ) |
||||
Online Master of Science in Agronomy
With a focus on industry applications and research, the online program is designed with maximum flexibility for today's working professionals.
